Cryptocurrency (Coins)
Will Tether (USDT) Kill Bitcoin? Evidence, Transparency & Future Outlook

Trading cryptocurrency can be both rewarding and soul destroying, especially considering the recent bloodbath in Bitcoin. Searching online for reasons as to the sharp decline in the BTC price yields fascinating results. “Hodlers,” investors, and speculators have come up with a multitude of factors that contributed to the crypto crash of 2018. Governments, regulators, whales, futures have all taken the blame for conspiring to crush the decentralized currency.
What if it was all a lot simpler than that? What if the recent 65% drop in BTC was merely the work of a few bad actors controlling a large segment of the market? Trying to make sense of Tether and its impact on the crypto marketplace will raise a lot of FUD (Fear, Uncertainty, and Doubt) on forums and social media if you wander down the wrong thread.
The Conundrum of Trading Crypto on Exchanges

Trading cryptocurrency requires a few steps; register with an exchange, open an account, download software and place your first order. To cash out of the trade and realize profits as fiat currency in a bank account, customers need to send the exchange identity documents and proof of address verifying their details, to satisfy KYC and AML laws.
Two types of exchanges operate in the crypto markets, those that offer cryptocurrency trading in USD pairs and settle client accounts in USD, and those that do not provide USD pairs and USD redemption on trades. Coinbase/GDAX, Kraken, and Gemini are examples of exchanges that meet the requirements of the financial regulations needed to trade and cash out customer accounts for USD.
Bitfinex, Bittrex, Poloniex, and Binance are examples of exchanges that do not settle in USD but allow withdrawals in cryptocurrencies such as USDT, ETH, and BTC. This circumvention strategy allows the exchanges to avoid the hassle of complying with regulatory laws while legally operating a cryptocurrency exchange.
What is Tether?

Tether launched in mid-2015 as a solution to two underlying problems in the cryptocurrency trading world. First, Tether solved the problem of trading and settling customer accounts in USD by the non-compliant exchanges. The second problem Tether cleared up was aimed at the traders themselves. In periods of high price volatility, traders can cash out their crypto balances into Tether to escape swift adverse price action. When traders feel confident to enter the market again, they may convert their Tethers to the cryptocurrency of their choice and begin trading.
The reason this “Stablecoin” business model works is that Tether Limited guarantee that it would peg the price of Tether to the dollar at a rate of 1:1. Tether enforce this peg with open market operations between the non-compliant exchanges. All cryptocurrency pairs available on these non-compliant exchanges trade against Tether (USDT) trading pairs and accounts are settled in USDT (Tether), not USD.
Blind faith in the fact that Tether Limited will redeem USDT for USD at a rate of 1:1 is what keeps bots and traders arbitraging USDT between exchanges, thereby balancing the peg with their trading operations. As long as the non-compliant exchanges can keep the USD/USDT peg at the guaranteed ratio, the price of Bitcoin and other cryptocurrency's will be equal in both USD and USDT.
Shady Start-up and the Bitfinex Connection
Tracing the history of Tether and Bitfinex leads to some suspicious activity and a connection between the companies that was previously denied by the company's founders.
2012 sees iFinex founded in Hong Kong to become the parent company for both Bitfinex and Tether. Bitfinex incorporates in Hong Kong during 2013 and is run by CEO Jan Ludovicus van der with the help of Phil Potter and CFO Giancarlo Devasini.
Potter and Devasini decided to establish Tether Limited in the British Virgin Islands, while publicly stating that Bitfinex and Tether are entirely separate entities. Tether began trading on February 25, 2015, however; USDT circulation and issuance experiences very little growth in 2015 and 2016.
The second half of 2017 was challenging for Tether and Bitfinex. The “Paradise Papers” were leaked on November 7, 2017, proving that Bitfinex and Tether are owned and operated by the same people.
Bitfinex Hacked

On August 2, 2016, the second-largest digital currency exchange heist in history took place as hackers stole nearly 120,000 Bitcoin, worth around $75 million. This event was the most significant crypto hack of an exchange since the infamous Mt. Gox fell in 2014. Bitfinex did not disclose the full details of the hack. However, BitGo, the security company responsible for signing off on all transactions, issues a statement saying its servers were not involved in any security breach or compromised in any way.
Tether Hacked
On November 19, 2017, theiFinex group experiences its second hack as cyberthieves get away with 31 million USDT. Hackers breached the security of the Tether treasury wallet, sending the bitcoin to an unauthorized wallet address. To quarantine the funds from being spent by the thieves, Tether initiates a hard fork to the Omni chain.
Bitfinex Accused of Manipulation Tactics

As if two hacks and a sensitive document leak wasn't enough bad news for Tether and Bitfinex, in August of 2017 a Twitter user named @bitfinexed begins to blog. The blogs start to expose price manipulation tactics used by Bitfinex and Tether to move the Bitcoin market in the desired direction. The first blog introduced “Spoofy” a trading bot similar to the “Willy” bot that manipulated prices on the Mt. Gox exchange before its failure.
The @bitfinexed Twitter account and Medium blog collected an impressive amount of evidence against Bitfinex that included manipulation strategies such as “Quote Stuffing,” “Flash Orders,” “Wash Trading,” “Spoofing,” “Painting the Tape,” “Front Running,” and even trading against their own book.
Recent allegations against tether have suggested that they do not have the USD reserves to back the USDT held in their reserves and circulating through the crypto marketplace. If this is the case, then Bitfinex have created a money printer in Tether Limited that allows them to purchase Bitcoin with free money.
Bitfinex allegedly buys up the Bitcoin with freshly printed Tethers that are not backed by any USD and then proceeds to dump the BTC on real USD exchanges. Should this fraud be proven to be true, then Bitfinex and Tether would be at the center of one of the biggest financial scams in history.
The Audit That Never Was

When Tether Limited launched, they announced that they would be undertaking an annual audit of their finances. The nature of the audit was to provide transparency to their clients and the market, creating confidence around USDT and its legitimacy. It was not long afterward that Bitfinex experienced the second most extensive hack of all time with hackers stealing $75 million worth of BTC.
On August 17, 2016, Bitfinex announced that it had contracted a blockchain forensic firm, Ledger Labs, to investigate the hack as well as conduct a financial audit of its USD and USDT assets. After months with no update on the audit or the theft, Bitfinex states that it had never contracted Ledger Labs to conduct an audit.
Over the following year, Bitfinex loses Wells Fargo as their last tie to the international banking system in the United States. Shortly after that, Bitfinex also has their Taiwanese banking accounts closed, and they are forced to take deposits through shell company bank accounts incorporated in the BVI and other tax havens.
There was no further mention of an audit until Bitfinex engages Friedman LLP to audit their balance sheet on May 5, 2017. The 2017 bull run in Bitcoin takes off around this time as prices accelerate to new all-time highs on announcements of Japans acceptance of Bitcoin as legal tender.
At the peak of the Bitcoin bubble mania on December 2, 2017, Bitfinex announces in a quarterly report that it will stop serving U.S. customers. The move starts an investigation by the SEC and CFTC into price manipulation, and fraudulent ICO's, resulting in a subpoena served on Bitfinex on December 6, 2017. This news was kept from public knowledge and did not have any effect on the popping of the Bitcoin bubble only two weeks later.
In a shock move, Freidman LLP withdraws from the Tether audit on January 27, 2018. They remove all mention of the Bitfinex audit from their website and make a public statement that says they are unable to complete the audit. Tether has since not attempted to engage other auditors in the big four group of accounting firms.
While all of these facts do seem scandalous, there is no physical proof of these allegations at the time of this writing in mid-February 2018. Those that have chosen to question Bitfinex and Tether, such as the @bitfinexed account, experience ad hominem attacks from the Bitfinex PR team and network partners. It appears that Tether and Bitfinex will continue to side-step the audit and blame technical difficulties related to the nature of the crypto business for the delay.
Tethers Market Impact

Those that are aware of the Bitfinex and Tether scandal often state that Tethers portion of the total crypto market cap is only a drop in the bucket. This statement is true since all 2.3 billion of USDT printed represent about 0.6% of the total crypto market value. This small portion of the crypto ecosystem could not therefore possibly have any impact on asset pricing should it be proven to be a fraud.
This thesis does not take into account the trading volume, liquidity, and trading velocity of the USDT supply. Tether is the third most traded cryptocurrency, by volume, making a substantial contribution to trading volumes across all major exchanges. The current money velocity of USDT is around 57. Considering that real USD only has a money velocity of 4.4, it's apparent that USDT is changing hands in the marketplace at a frenetic pace.
If Tether disappeared from the marketplace due to a hack or lost its USD peg for various possible reasons, the results could be disastrous. If everyone tried to redeem Tether tokens for real USD, even if that were possible, there would most likely be a liquidity crunch where exchanges would be unable to fill sell orders as the price declines. With Tether now accepted on most major exchanges for a range of cryptocurrencies, “hodlers” and traders face the possibility of losing money in the event of a price crash.
Piecing together the Puzzle

All of the allegations against Tether and Bitfinex yet to have been proven with concrete evidence. Until Tether Limited can produce an independent third party audit, they will remain under suspicion with a large part of the crypto community. 2018 is shaping up to be another exciting year for Tether and Bitfinex. The results of the CTFC and SEC investigations and the ongoing audit saga combined with the popping of the Bitcoin price bubble are sure to keep crypto enthusiasts and investors glued to their newsfeeds. Trade and hedge accordingly.
Price Analysis
Bitcoin Price Starting to Recover After Sharp Drop; Top Alts Ethereum and Litecoin Are Struggling
Bitcoin BTC/USD Forecasting
From yesterday's open at $12317 the price of Bitcoin increased to $12761 but then fell below its opening price as it came down to $12100 level. After this retracement, the start of another rise has been seen with the price reaching $13055 at its highest point today before falling nearly $800 in an hour.
The price momentum has been stopped out after an increase of 7.76% measured from yesterday's low at $12100 as the price started encountering resistance around the vicinity of the prior high on the ending point of the 5th wave of the upward impulse.
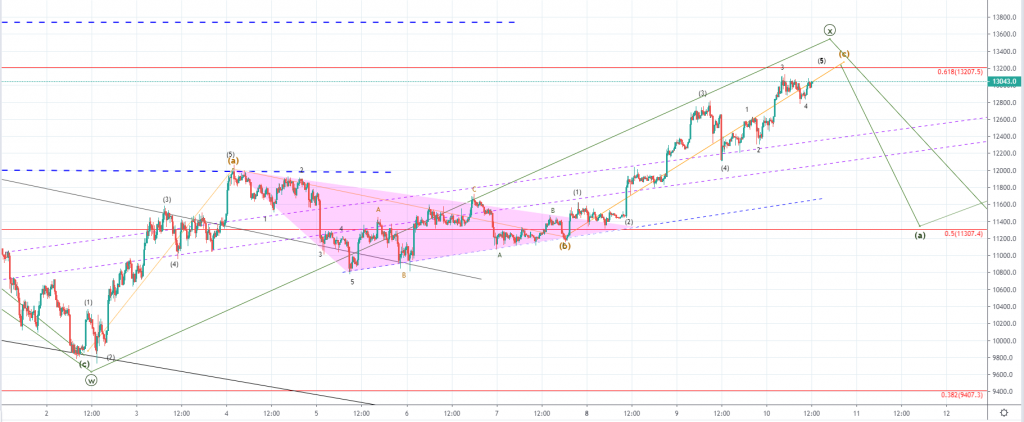
Looking at the 15 min chart, you can see that the price got close to the 0.618 Fib level but there hasn't been an interaction before the price found resistance and has started to flat out, forming a horizontal resistance point. As we are seeing the ending wave of the five-wave impulse its further development would be expected to end around the vicinity of the 0.618 Fib level and proper interaction with the price potentially exceeding it on the spike up.
This would be the completion of the five-wave impulse which started on the 7th of July and is the third wave out of the upward structure from the 2nd of July. Previous to the five-wave increase a corrective triangle has been seen forming which was according to my count the B wave out of the upward ABC three-wave move. This three-wave move would be the X wave of the higher degree count which is why after its completion which is set to develop very shortly I would be expecting a move to the downside as the third wave Y should develop.
Another possibility would be that the correction ended on the first three-wave move which are only the sub-waves of the W wave according to the current count. If that is true, then we could be seeing the development of another five-wave move instead of the three-wave ABC correction to the upside. In either way, from here I would be expecting a move to the downside and if the price falls below the lower interrupted blue horizontal level on the retracement I would indicate that the move to the upside has ended on the third wave and is corrective and not impulsive.
Ethereum ETH/USD Forecasting
From yesterday’s high at $317.62 the price of Ethereum has decreased by 4.61% measured to its lowest point today which is at $302.98. The price has recovered since and came up to around $314 after, but is currently being traded at $309.
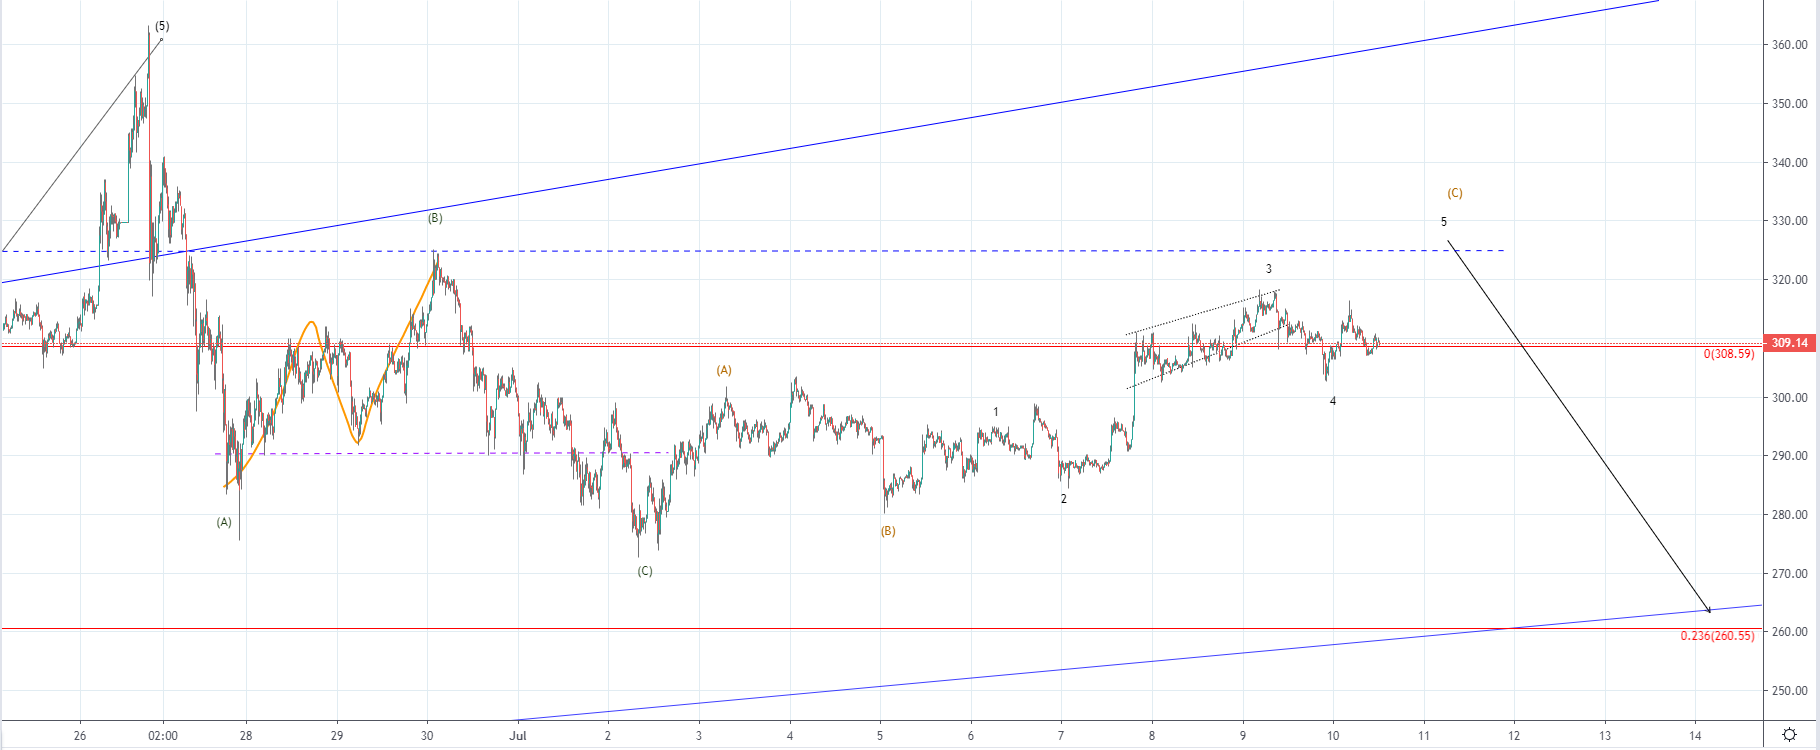
Looking at the 15 min chart, you can see that the price is currently retesting the 0 Fib level for support as a minor breakout above occurred. The price is likely to find support at the present levels as a breakout occurred on the prior high as well and has shown the absence of strong seller’s pressure.
As we are seeing the development of a five-wave impulse to the upside from 5th of July its ending wave’s development would now likely mean further increase but only for a short while as the next significant horizontal level is getting close. This is the ending point of the prior high and the support point of the impulsive move’s ending point and now serves as significant resistance.
If we are seeing a three-wave ABC to the upside out of which the mentioned five-wave impulse from the 5th of July is the C wave, the price is set to start moving to the downside after its completion, below the ending point of the first ABC to the downside which is at $276.
Upward ABC would be the second wave out of the higher degree three-wave correction which is why the third one would be expected to end on a lower low compared to the first ABC correction which would be its first wave. The most optimal target point of the expected decrease would be around the intersection of the lower ascending level which represents an uptrend support level and the 0.236 Fib level which is at $260.5.
There is a possibility that instead of the price ending its increase from the 5th of July on the third wave, we see it developing in a five-wave manner which will indicate impulsiveness instead of the currently presumed corrective momentum.
In that case, the price of Ethereum cannot go below $296 which is the territory of the 2nd wave on which the price cannot enter on the 4th if we are seeing a five-wave increase which is why the level is serving as a significant pivot point.
Litecoin LTC/USD Forecasting
From yesterday's high at $124.6 the price of Litecoin decreased by 5.37% as it came down to $117.9 at its lowest point today. The price came down to the same low level after a recovery attempt has been stopped out at $119.95, but the price is currently being traded around $119.180.
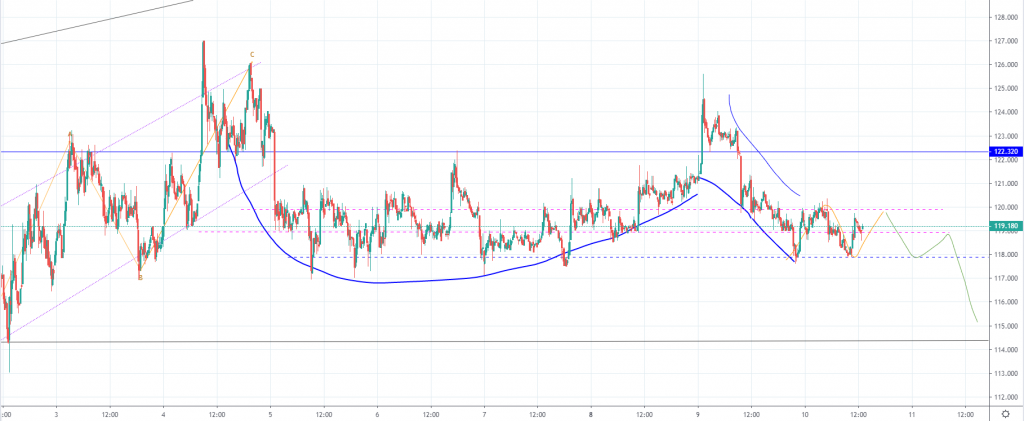 On the 15 min chart, you can see that the price of Litecoin came down to the first significant horizontal support level which is the lower outline level off of the horizontal range in which the price action is bouncing from 5th of July. Including the price action from the day before we have seen the formation of a cup and handle pattern with the price continuing to form the handle structure from yesterday's spike abode the significant horizontal level at $122.32 which is considered as the median point of the higher degree resistance range.
As the price failed to keep up the upward momentum and instead left a spike to the upside falling down fast below the significant horizontal level indicating strong resistance is present above, we have seen a retest of the lowest support level from the mentioned pattern. The price has recovered slightly but again failed to exceed the median point of the horizontal range from 5th which got broken in the second half of yesterday's trading session.
The recovery has developed a retest of the median point and another retest of the support level from the horizontal range with the price currently holding above its half range line. I would be expecting another minor increase which could be another retest of the today's high after which another downfall below today's support level. Even though the handle still hasn't been broken we have seen the price retracing back to the cup's support level which could be viewed as a breakout.
In either way, I would be expecting a retest of the $114.31 horizontal level which was low from the 2nd of July and was the ending point of the five-wave impulse to the downside after which a corrective ABC to the upside has been seen. This is why I think that a breakout from the downside would lead to the formation of another impulsive move which would set to push the price of Litecoin back inside the lower range below the resistance zone at $109.
Conclusion
The price’s of the major cryptos are starting to reach their significant resistance point on the corrective increase whos continuation we’ve seen in the last 24 hours. As the prices are approaching their signifiant resistance levels, after an interaction I would be expecting another downturn in the market.
Price Analysis
Bitcoin (BTC), Ethereum (ETH), and Litecoin (LTC) Price Prediction for Today’s Top Cryptocurrencies

BTC/USD
From yesterday's high at $13212 the price of Bitcoin decreased by 21.23% as it came down to $10407 at its lowest point today. Yesterday's high was an interaction with the significant 0.618 Fibonacci level which ended as a rejection and caused the price to start moving to the downside in an impulsive manner.
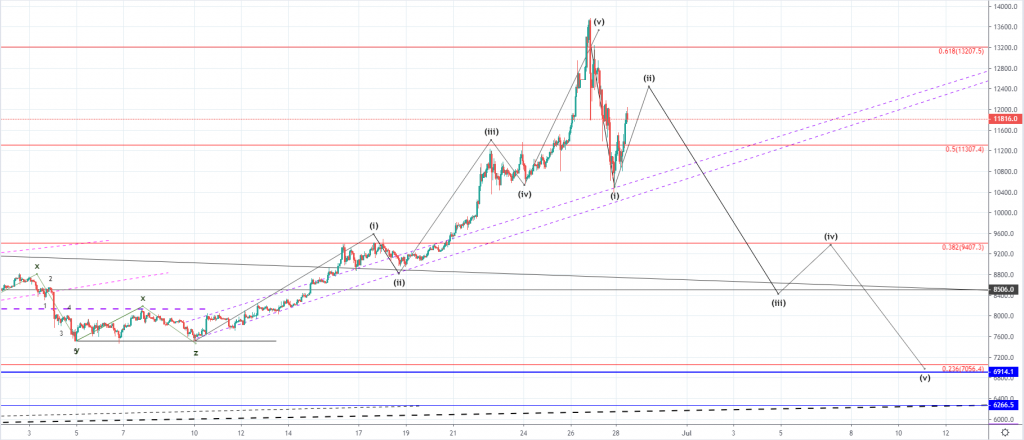 Looking at the hourly chart you can see that the price came below the 0.5 Fibonacci level and stopped out at the minor ascending trendline from the from 10th of June from when the last five-wave impulse started developing. As the price found support there an immediate recovery has started which managed to pull the price back above the 0.5 Fib level and is currently being traded at $118816, slightly below today's high at $12012.
The price recovered by over 14% today measured to the lowest spike to the highest point today but it appears that strong resistance has been encountered as indicated by the last hourly candle. This recovery appears to be correctional and is most likely the 2nd wave out of the starting downtrend. I wouldn't expect it to go above $12451 which would be a 0.618 Fib from the impulsive decrease if the corrective movement is in play.
We've seen the completion of the five-wave impulse from 10th of June which could have been the 5th wave from the higher degree count which I believe that it was. If this is true, then we are going to see further downside for the price of Bitcoin in the upcoming period as a correction of the same degree should develop.
On the hourly chart, you can see that I've projected a target to around $6914 but the price of Bitcoin could go significantly lower as it would be only the first wave to the downside. The five-wave move might not develop and we could instead see a three-wave correction to $8500 before further upside continuation but considering the seller's momentum seen from yesterday, I don't believe that Bitcoin's price is going to continue increasing further.
ETH/USD
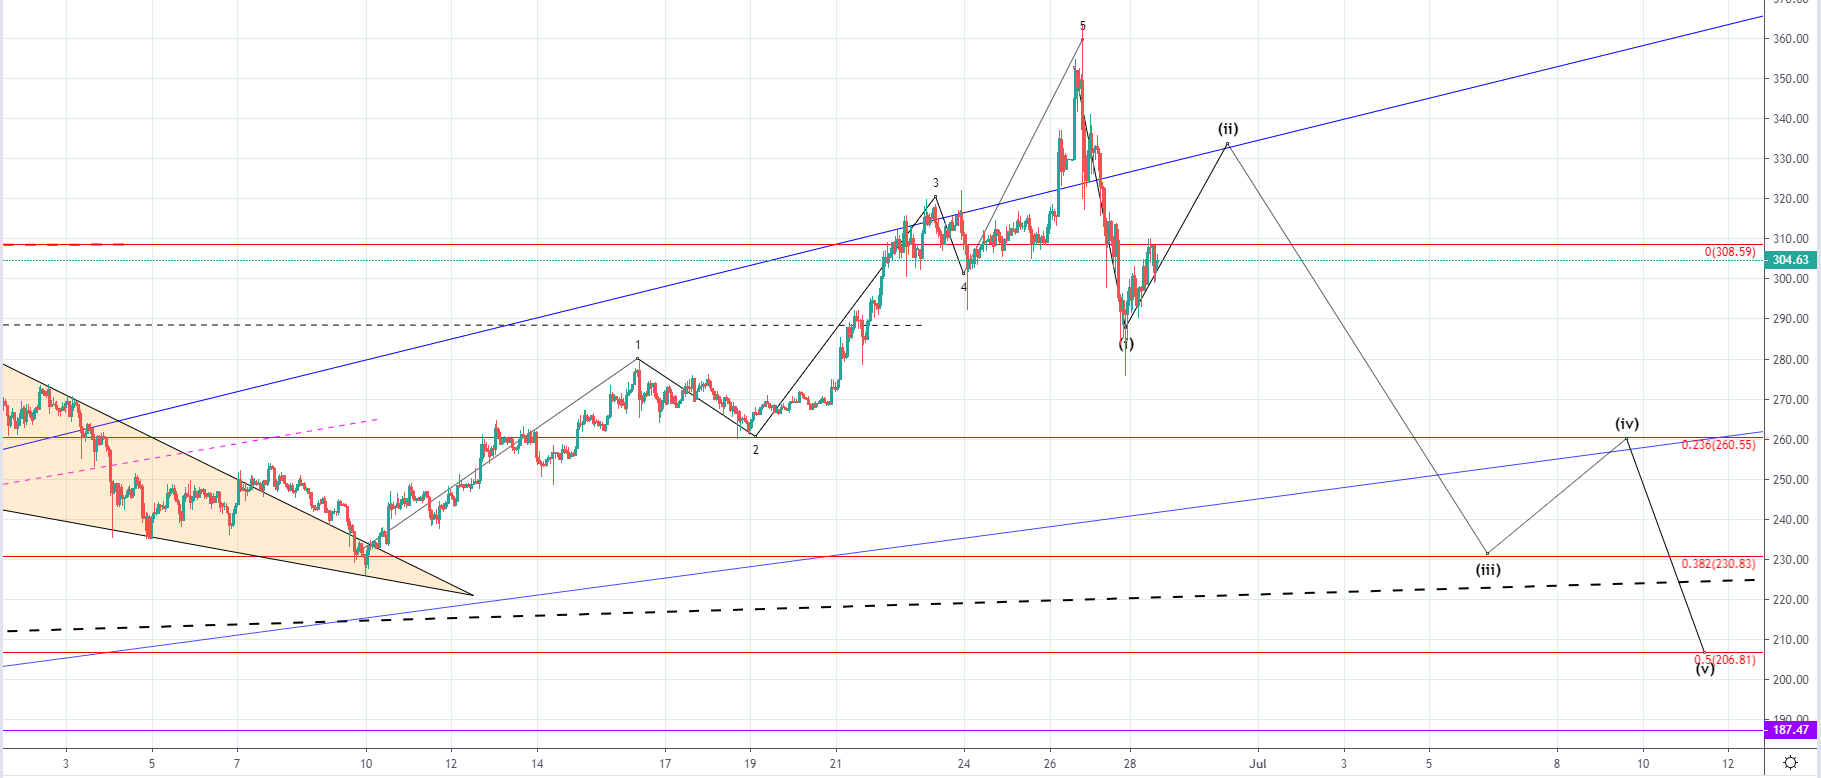
From yesterday’s high at $336.1 the price of Ethereum has decreased by over 18% measured to the lowest spike the price has been which is at $275.45, but the hourly candle closed above $290.7.
The price is currently being traded at around $304 and was in an upward trajectory until it reached the significant Fibonacci level at $308.59 where it found resistance on the interaction.
As a rejection occurred the price has started moving to the downside again and looking at the hourly chart you can see that its minor uptrend line still hasn’t been broken.
The increase still might continue to the significant ascending trendline which was broken but the price fell immediately inside the territory of the ascending channel, ending as a fakeout. This is why the level might get retested again on the current recovery but we are yet to see how strong is the momentum behind today’s increase.
For now, it looks weak as the Fibonacci level was able to stop it out, so now that the price started moving to the downside we could see the price starting to move below the minor ascending trendline from today’s low.
Prior to the impulsive decrease, we have seen the completion of the five-wave impulse to the upside which could have been the ending wave of the higher degree with now a downturn starting to develop as the bullish period ended.
If we are seeing the development of the higher degree correction we are likely to see a five-wave move to the downside in an impulsive manner which would only be the first wave out of the potential three-wave move of the higher degree.
In that case, the price of Ethereum would be expected to go for a retest of some major resistance point, broken on the way up, out of which the first significant one would be between $187 and $174.
LTC/USD
From yesterday's high at $130.322 the price of Litecoin has decreased by 13% coming to $113.36 at its lowest point and even spiked further to the downside coming to $110.69 but the hourly candle closed above $133 leaving a wick on the hourly chart. The price is currently being traded at $117.69 slightly below today's high at $119.7 as a minor recovery has been made.  On the hourly chart, you can see that the price of Litecoin fell inside the territory of the lower horizontal range between the $122.32 level and the $109.356 horizontal pivot. This area is highly significant as it was considered to be the support area from the first half of the bear market and managed to hold the price of Litecoin but was eventually broken on the 10th of June 2018. Out of this support/resistance, the $137 horizontal level was its furthest level and considering that the interaction with it ended as rejection with an impulsive downside move seen after, we have likely seen a retest of the broken support for resistance before further downtrend continuation.
From 5th till 12th of June we have seen the development of the five-wave move to the upside which was most likely the ending wave of the higher degree as immediately after its completion we've seen a sideways range forming before a straight downfall. This impulsiveness to the downside indicates that the sellers are taking control. If we are seeing the development of the downtrend and from 26th its first wave in a five-wave manner the price is set to go below the last horizontal support level at $109 and would enter the lower range below the support zone.
If this occurs we could view it as a confirmation of the starting downtrend as the price of Litecoin was continuously increasing from 29th of April and made an increase of 112% without a major correctional movement. That this might not be a correction and instead of a starting downtrend we are yet to see from the development of the last move to the downside, but if it were to develop in a five-wave manner with the price going below the last horizontal level the possibility of the starting downtrend would increase significantly.
Conclusion
The cryptocurrency market has experienced a recovery today but the prices of the major cryptos have shown early signs of weakness around their first minor resistance points. We are yet to see if the recovery continues but as the impulsiveness was exhibited by the sellers in the last 24 hours I believe that the prices aren’t headed further up and that we are seeing the start of the downtrend.
Ripple price surged higher recently above $0.4400 and $0.4600. XRP to USD is currently correcting lower, but the $0.4255 level is likely to act as a strong support and buy zone.
Key Takeaways: XRP/USD
- Ripple price traded to a new monthly high at $0.4625 and recently corrected lower against the US Dollar.
- XRP/USD is testing the $0.4320 support and a major bullish trend line on the 2-hours chart (data feed from Bitstamp).
- Bitcoin price is also correcting lower from well above $9,400 and Ethereum price is currently below $270.00.
Ripple Price Analysis
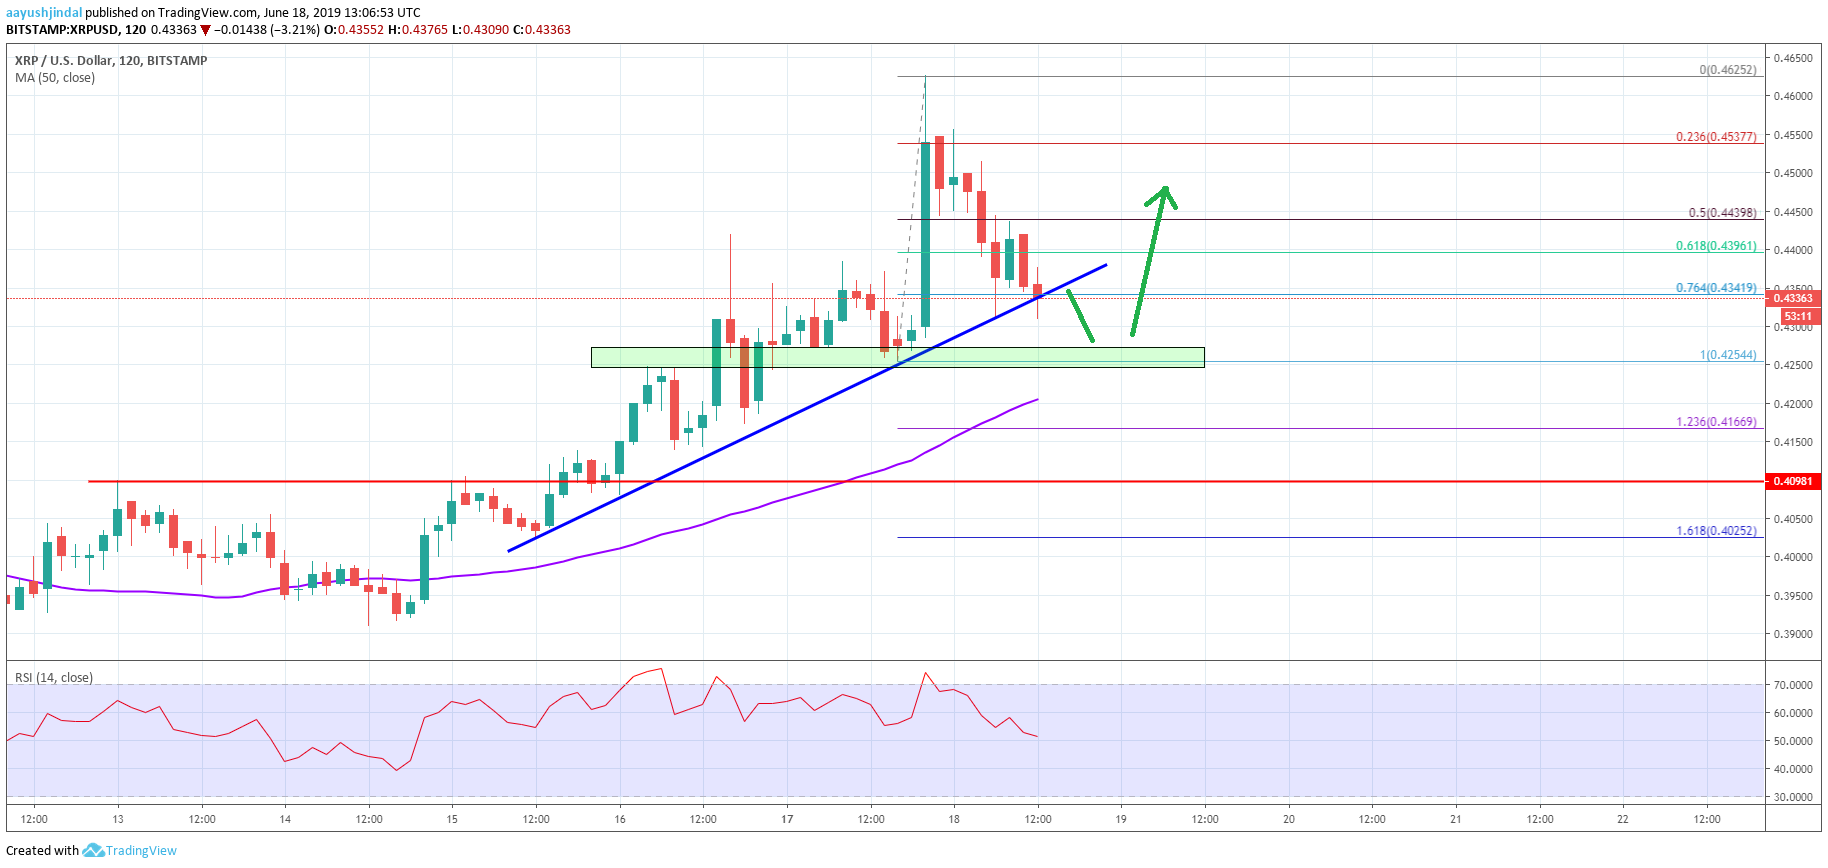
Earlier this week, bitcoin price extended gains above $9,300 and $9,400. It helped ripple and its price recently started a strong rise above the $0.4200, $0.4320 and $0.4400 resistance levels. XRP even broke the $0.4500 level and traded to a new monthly high.
Looking at the 2-hours chart, ripple price even traded above the $0.4600 level and settled well above the 50 simple moving average (2-hours, purple). A high was formed at $0.4625 and recently, the price started a sharp downside correction.
There was a break below the $0.4520 support and the 50% Fib retracement level of the recent wave from $0.4254 to $0.4625. Moreover, the price broke the $0.4400 support level.
It is currently testing the $0.4320 support and a major bullish trend line on the 2-hours chart. The 76.4% Fib retracement level of the recent wave from $0.4254 to $0.4625 is also acting as a support.
If there is a downside break, the price could test the main support near the $0.4255 level. As long as ripple price is above $0.4255, it is likely to bounce back in the near term.
An initial resistance is near the $0.4400 level, above which ripple is likely to continue higher towards the $0.4480 and $0.4500 levels. If the bulls regain strength, XRP price could even retest the $0.4625 swing high.
Overall, ripple price is trading with a strong bullish bias above $0.4255 and $0.4150. Therefore, there are high chances of a fresh increase above the $0.4400 and $0.4480 resistance levels in the coming sessions.

Bitcoin Price Starting to Recover After Sharp Drop; Top Alts Ethereum and Litecoin Are Struggling

Bitcoin (BTC), Ethereum (ETH), and Litecoin (LTC) Price Prediction for Today’s Top Cryptocurrencies

Ripple Price Analysis: XRP/USD Primed For Further Gains

Bitcoin Price Analysis: BTC Surging, Next Stop Could Be $9,750

Ethereum Price Analysis: ETH Approaching Significant Support Area

Bitcoin Price Analysis: BTC Setting Up For Another Bull Run

Crypto Media Site CCN Announces It’s Shutting Down After Latest Google Update

Bitcoin (BTC), Ethereum (ETH), Litecoin (LTC) and Bitcoin Cash (BCH) Price Analysis June 10th

Facebook and the CFTC Discuss The Future of the GlobalCoin
