Cryptocurrency (Coins)
ICON (ICX): Decentralized Blockchain Network & Crypto Token Wallet?
About ICON (ICX)
Ever active in matters crypto, South Korea has again given rise to a blockchain project in ICON. A different and unique blockchain construct, ICON is aimed at generating or rather servicing an inevitably huge scale ecosystem.
In allowing various blockchain platforms to connect, ICON enters the cryptosphere as a huge enabler both for existing businesses and other entities, as well as for developers. Now individual projects built at universities or banks, hospitals and other private blockchain projects can share information via the ICON project.
Acting as a bridge between any public or private blockchain – think Bitcoin, Ethereum, Neo and also the WHO, national government institutions and massive concerns like academic hospitals – ICON has a very specific focus. In a nutshell, what makes the ICON altcoin unique is its “Loop Fault Tolerant” consensus algorithm.
An online ledger that eliminates intermediaries, the project lacks the individual limitations of almost all other digital currencies to transact across platforms in many meaningful ways. As opposed to isolating protocols, ICON seeks to become a friend to all, seamlessly providing comms between any blockchain platform so far developed.
ICON Coin Technical Pros And Cons
![]()
Decidedly a different cryptocurrency and utility coin all in one, a very different set of blockchain protocols are at play in the project build. Employing a proprietary LFT algorithm enables the coin to flit happily across platforms as users desire. Although dedicated coders have nitpicked at some aspects of the altcoins protocols, the fundamental aim has been successfully met by building with LFT.
The Loop Fault Tolerance algorithm employed by the project is essentially an improved Byzantine Fault Tolerance (BFT) algorithm that enables far faster transaction speeds. It also concludes transactions with almost random autonomy across nodes and eliminating the possibility of forks emerging from within the network.
Since blockchain consensus is the primary input into transaction speeds, by employing a better, faster protocol, ICON users enjoy much quicker transacting and it also opens the door to a host of potential app development.
By creating a group among trusted nodes, the LFT protocol marries various consensus protocols by empowering the nodes to determine vote numbers. A part of the build is the virtually complete independence of communities that the company sees as essential to build the potentially infinite cryptosphere.
Although the white paper exudes a globalist ethos, the reality is that the project is rather a system of highly autonomous communities, and each community can determine its own rules and protocols, including its own consensus algorithm.
An immediate benefit of the coin is apparent in these times of regulatory inspection, as it allows participants in different countries with often differing laws and other regulations to transact freely. The decentralized ICON Republic blockchain employs a token (ICX) that allows almost any development to be as private or constantly shared as users desire.
Third party dapps for broad or entirely targeted deployment are also enabled by the project, and the coin is also not needed within active communities. The token is employed only when communities interact with each other or ICON Republic, when they interact with a dapp, or when dapps interact with one another.
Where Did ICON Begin?
ICON began when Theloop began partnering with certain key financial institutions, pitching its services of authentication and settlement systems that eliminated intermediaries. The company also offered trading systems with real-time trade matching.
Loopchain was already established as a reputable supplier of automated settlement and other solutions to the insurance industry. A divergent yet wholly symbiotic project, Theloop released ICON almost two years ago, billed as a distributed ledger providing industry-specific blockchain solutions.
Ultimately owned by the Dayli Financial Group, a large South Korean fintech company that has interests in various industries, ICON has enjoyed corporate backing. interestingly, Dayli is also the owner of Coinone, one of the biggest South Korean crypto exchanges. That ICON thus has easy access to a large exchange, where Bitcoin, Ethereum and others are traded makes the addition of the token likely to contribute to the coin’s popularity.
Korean investors remain extremely enthusiastic and active in the cryptosphere, accounting for between 20 and 40 percent of the global volume each year. South Koreans have a national bent towards seeing cryptocurrencies as investment assets rather than as currencies or payment solutions.
ICON’s Future Bright

ICON also runs a ICX-focused decentralized exchange (DEX) that sees ICX paired and traded. In a move that is reminiscent of backed cryptocurrencies, the ICON DEX also maintains currency reserves for individual ICON blockchain communities so that they can exchange real-time value via the ICON Republic. This establishes a further gateway through which ICON’s communities can connect with the ICON Republic.
ICON’s DEX has a core focus on currency value and transfer. All blockchain projects connected to the ICON Republic can trade and transact freely across the platform. Employing AI, the exchange sets exchange rates that govern transactions. The ICON coin (ICX) is used as an intermediary currency on the exchange, utilized in trading pairs.
With South Korea boasting the world’ 11th largest economy and ranked in the top five Information and Communication Technologies (ICT) counties, the fundamental platform of ICON is finding fertile home ground and user numbers have been climbing as the project becomes known. Adding the word “local” to “cryptocurrency” makes for a popular coin in Asia overall, but China and South Korea have always led the locally enthusiastic crowd.
ICON ICX Conclusion
Hard-capped at 150,000 ETH, the token’s ICO was successful although not extravagant, raising over $40 million. The ICO issued 50 percent of the total token supply, with the remainder being allocated to the development team, various partners and the foundation itself. Viewed as a going concern, the project has a remarkably high number of dedicated developers, employing around 30 designers and engineers who continue to optimize the project.
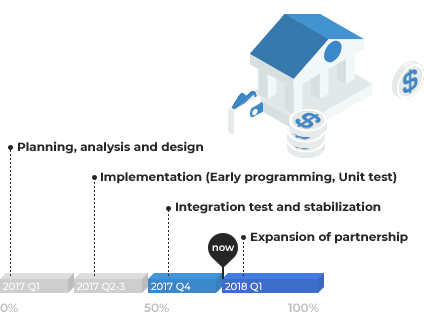
Unashamedly ambitious, seeking to “hyperconnect” the world, ICON aims at becoming one of the biggest if not the absolutely biggest blockchain in the world. Positioned with partnerships that include Coinone and Ripple, the company has the benefit of the financial clout to make these dreams come true.

It is obligatory for any startup to be wildly enthusiastic about changing the world. The difference with ICON is that it has come through a process of corporate planning and budgeting, and is thus a highly respectable token that has a voice investors can hear and understand. Technical fundis have complained about ICON’s employment of the Bancor protocol in its smart contracts. The Bancor protocol has long been known to contain a flawed pricing equation.
Through a convoluted chain, fluctuations in the price of Ether can impact ICX users. By virtue of the flawed Bancor protocol deployment in the build, contracts can become suddenly more valuable than ICX itself, so theoretically all humans and bots will sell the coins back to the contract, eliminating coins en masse.
That said, the developers have defended their build as essentially to facilitate overarching imperatives. With loads of top-tier connections and solid corporate backing, ICON is a project that should fly into the future, trading particularly on a strong local support base.
Price Analysis
Bitcoin Price Starting to Recover After Sharp Drop; Top Alts Ethereum and Litecoin Are Struggling
Bitcoin BTC/USD Forecasting
From yesterday's open at $12317 the price of Bitcoin increased to $12761 but then fell below its opening price as it came down to $12100 level. After this retracement, the start of another rise has been seen with the price reaching $13055 at its highest point today before falling nearly $800 in an hour.
The price momentum has been stopped out after an increase of 7.76% measured from yesterday's low at $12100 as the price started encountering resistance around the vicinity of the prior high on the ending point of the 5th wave of the upward impulse.
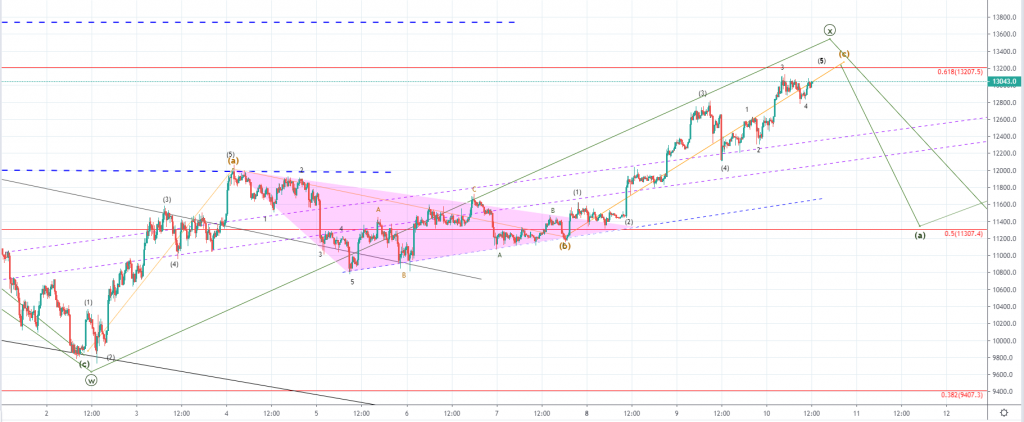
Looking at the 15 min chart, you can see that the price got close to the 0.618 Fib level but there hasn't been an interaction before the price found resistance and has started to flat out, forming a horizontal resistance point. As we are seeing the ending wave of the five-wave impulse its further development would be expected to end around the vicinity of the 0.618 Fib level and proper interaction with the price potentially exceeding it on the spike up.
This would be the completion of the five-wave impulse which started on the 7th of July and is the third wave out of the upward structure from the 2nd of July. Previous to the five-wave increase a corrective triangle has been seen forming which was according to my count the B wave out of the upward ABC three-wave move. This three-wave move would be the X wave of the higher degree count which is why after its completion which is set to develop very shortly I would be expecting a move to the downside as the third wave Y should develop.
Another possibility would be that the correction ended on the first three-wave move which are only the sub-waves of the W wave according to the current count. If that is true, then we could be seeing the development of another five-wave move instead of the three-wave ABC correction to the upside. In either way, from here I would be expecting a move to the downside and if the price falls below the lower interrupted blue horizontal level on the retracement I would indicate that the move to the upside has ended on the third wave and is corrective and not impulsive.
Ethereum ETH/USD Forecasting
From yesterday’s high at $317.62 the price of Ethereum has decreased by 4.61% measured to its lowest point today which is at $302.98. The price has recovered since and came up to around $314 after, but is currently being traded at $309.
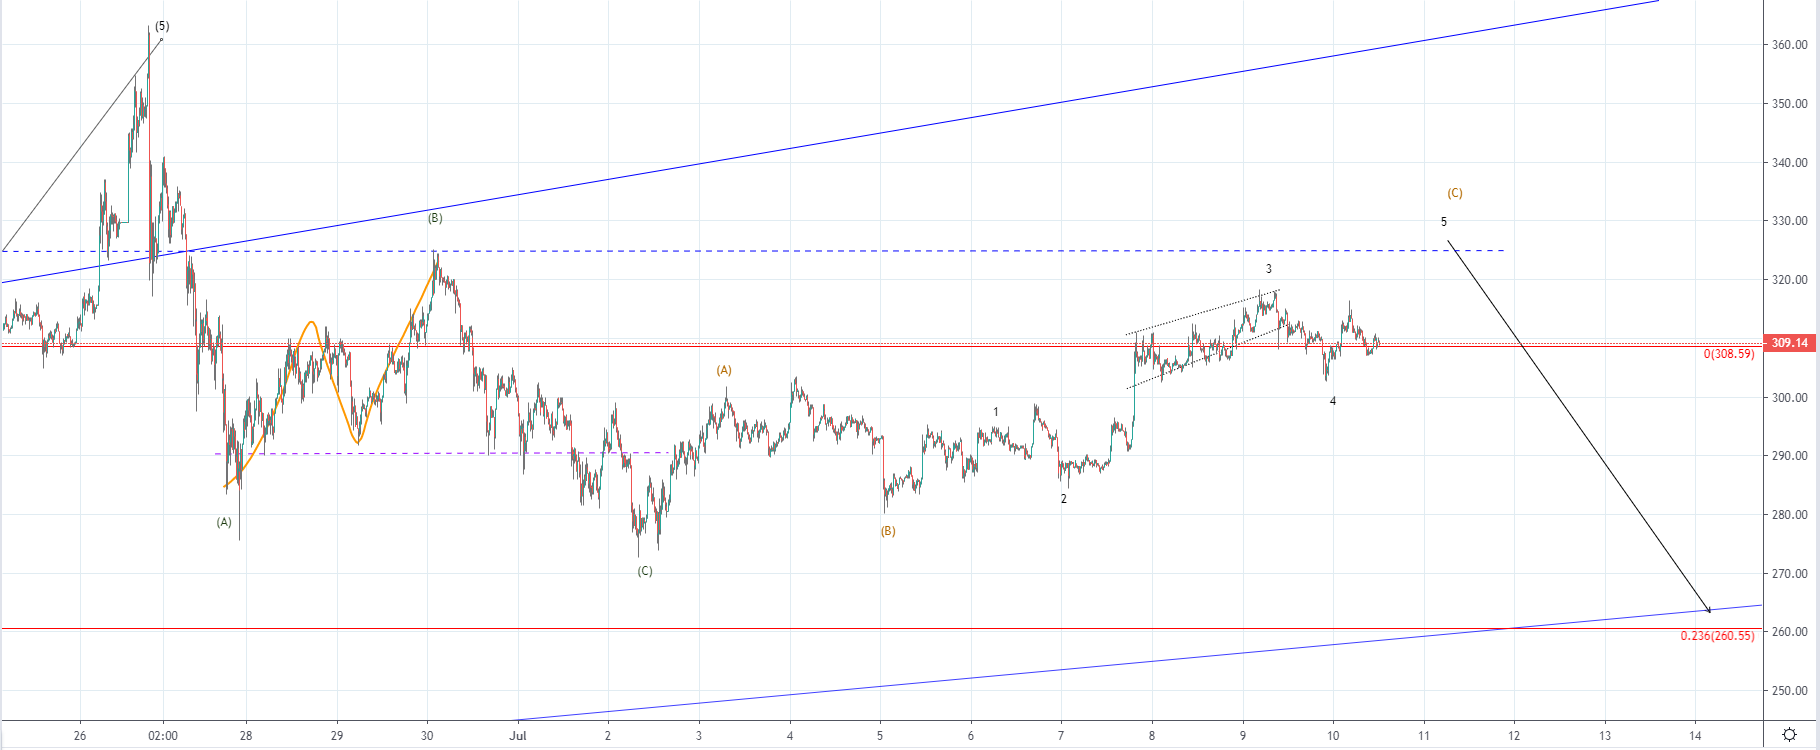
Looking at the 15 min chart, you can see that the price is currently retesting the 0 Fib level for support as a minor breakout above occurred. The price is likely to find support at the present levels as a breakout occurred on the prior high as well and has shown the absence of strong seller’s pressure.
As we are seeing the development of a five-wave impulse to the upside from 5th of July its ending wave’s development would now likely mean further increase but only for a short while as the next significant horizontal level is getting close. This is the ending point of the prior high and the support point of the impulsive move’s ending point and now serves as significant resistance.
If we are seeing a three-wave ABC to the upside out of which the mentioned five-wave impulse from the 5th of July is the C wave, the price is set to start moving to the downside after its completion, below the ending point of the first ABC to the downside which is at $276.
Upward ABC would be the second wave out of the higher degree three-wave correction which is why the third one would be expected to end on a lower low compared to the first ABC correction which would be its first wave. The most optimal target point of the expected decrease would be around the intersection of the lower ascending level which represents an uptrend support level and the 0.236 Fib level which is at $260.5.
There is a possibility that instead of the price ending its increase from the 5th of July on the third wave, we see it developing in a five-wave manner which will indicate impulsiveness instead of the currently presumed corrective momentum.
In that case, the price of Ethereum cannot go below $296 which is the territory of the 2nd wave on which the price cannot enter on the 4th if we are seeing a five-wave increase which is why the level is serving as a significant pivot point.
Litecoin LTC/USD Forecasting
From yesterday's high at $124.6 the price of Litecoin decreased by 5.37% as it came down to $117.9 at its lowest point today. The price came down to the same low level after a recovery attempt has been stopped out at $119.95, but the price is currently being traded around $119.180.
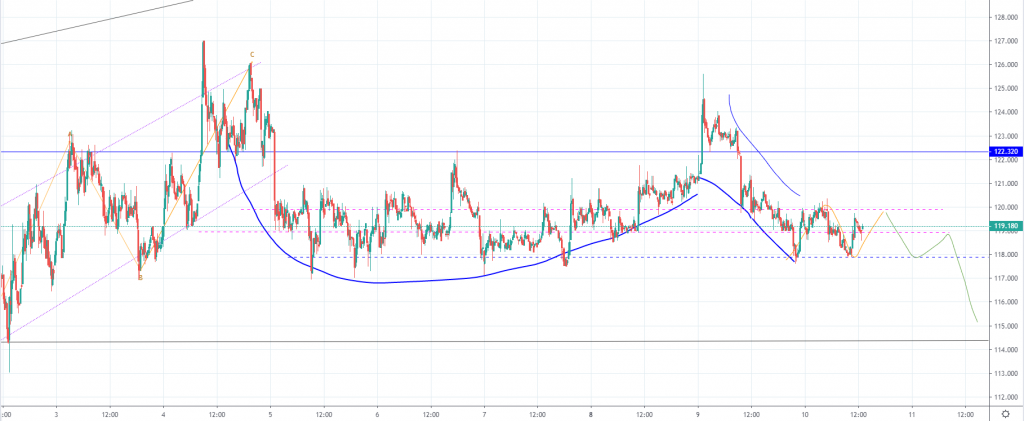 On the 15 min chart, you can see that the price of Litecoin came down to the first significant horizontal support level which is the lower outline level off of the horizontal range in which the price action is bouncing from 5th of July. Including the price action from the day before we have seen the formation of a cup and handle pattern with the price continuing to form the handle structure from yesterday's spike abode the significant horizontal level at $122.32 which is considered as the median point of the higher degree resistance range.
As the price failed to keep up the upward momentum and instead left a spike to the upside falling down fast below the significant horizontal level indicating strong resistance is present above, we have seen a retest of the lowest support level from the mentioned pattern. The price has recovered slightly but again failed to exceed the median point of the horizontal range from 5th which got broken in the second half of yesterday's trading session.
The recovery has developed a retest of the median point and another retest of the support level from the horizontal range with the price currently holding above its half range line. I would be expecting another minor increase which could be another retest of the today's high after which another downfall below today's support level. Even though the handle still hasn't been broken we have seen the price retracing back to the cup's support level which could be viewed as a breakout.
In either way, I would be expecting a retest of the $114.31 horizontal level which was low from the 2nd of July and was the ending point of the five-wave impulse to the downside after which a corrective ABC to the upside has been seen. This is why I think that a breakout from the downside would lead to the formation of another impulsive move which would set to push the price of Litecoin back inside the lower range below the resistance zone at $109.
Conclusion
The price’s of the major cryptos are starting to reach their significant resistance point on the corrective increase whos continuation we’ve seen in the last 24 hours. As the prices are approaching their signifiant resistance levels, after an interaction I would be expecting another downturn in the market.
Price Analysis
Bitcoin (BTC), Ethereum (ETH), and Litecoin (LTC) Price Prediction for Today’s Top Cryptocurrencies
BTC/USD
From yesterday's high at $13212 the price of Bitcoin decreased by 21.23% as it came down to $10407 at its lowest point today. Yesterday's high was an interaction with the significant 0.618 Fibonacci level which ended as a rejection and caused the price to start moving to the downside in an impulsive manner.
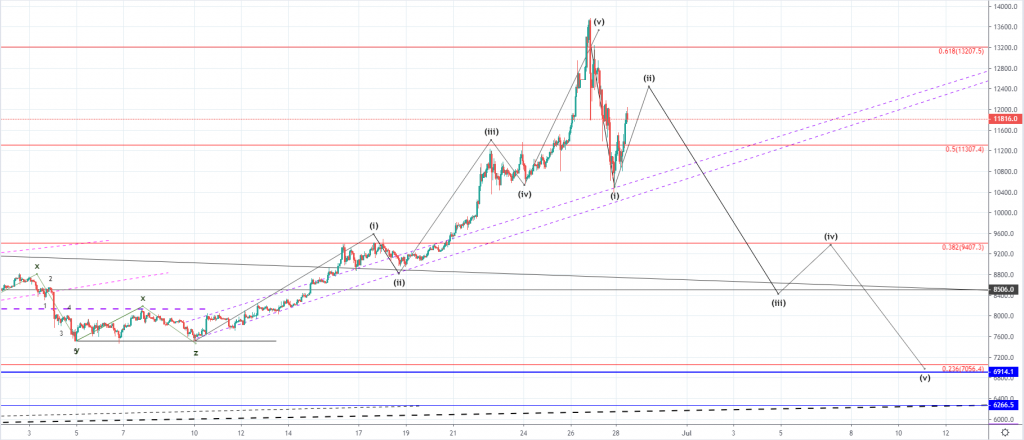 Looking at the hourly chart you can see that the price came below the 0.5 Fibonacci level and stopped out at the minor ascending trendline from the from 10th of June from when the last five-wave impulse started developing. As the price found support there an immediate recovery has started which managed to pull the price back above the 0.5 Fib level and is currently being traded at $118816, slightly below today's high at $12012.
The price recovered by over 14% today measured to the lowest spike to the highest point today but it appears that strong resistance has been encountered as indicated by the last hourly candle. This recovery appears to be correctional and is most likely the 2nd wave out of the starting downtrend. I wouldn't expect it to go above $12451 which would be a 0.618 Fib from the impulsive decrease if the corrective movement is in play.
We've seen the completion of the five-wave impulse from 10th of June which could have been the 5th wave from the higher degree count which I believe that it was. If this is true, then we are going to see further downside for the price of Bitcoin in the upcoming period as a correction of the same degree should develop.
On the hourly chart, you can see that I've projected a target to around $6914 but the price of Bitcoin could go significantly lower as it would be only the first wave to the downside. The five-wave move might not develop and we could instead see a three-wave correction to $8500 before further upside continuation but considering the seller's momentum seen from yesterday, I don't believe that Bitcoin's price is going to continue increasing further.
ETH/USD
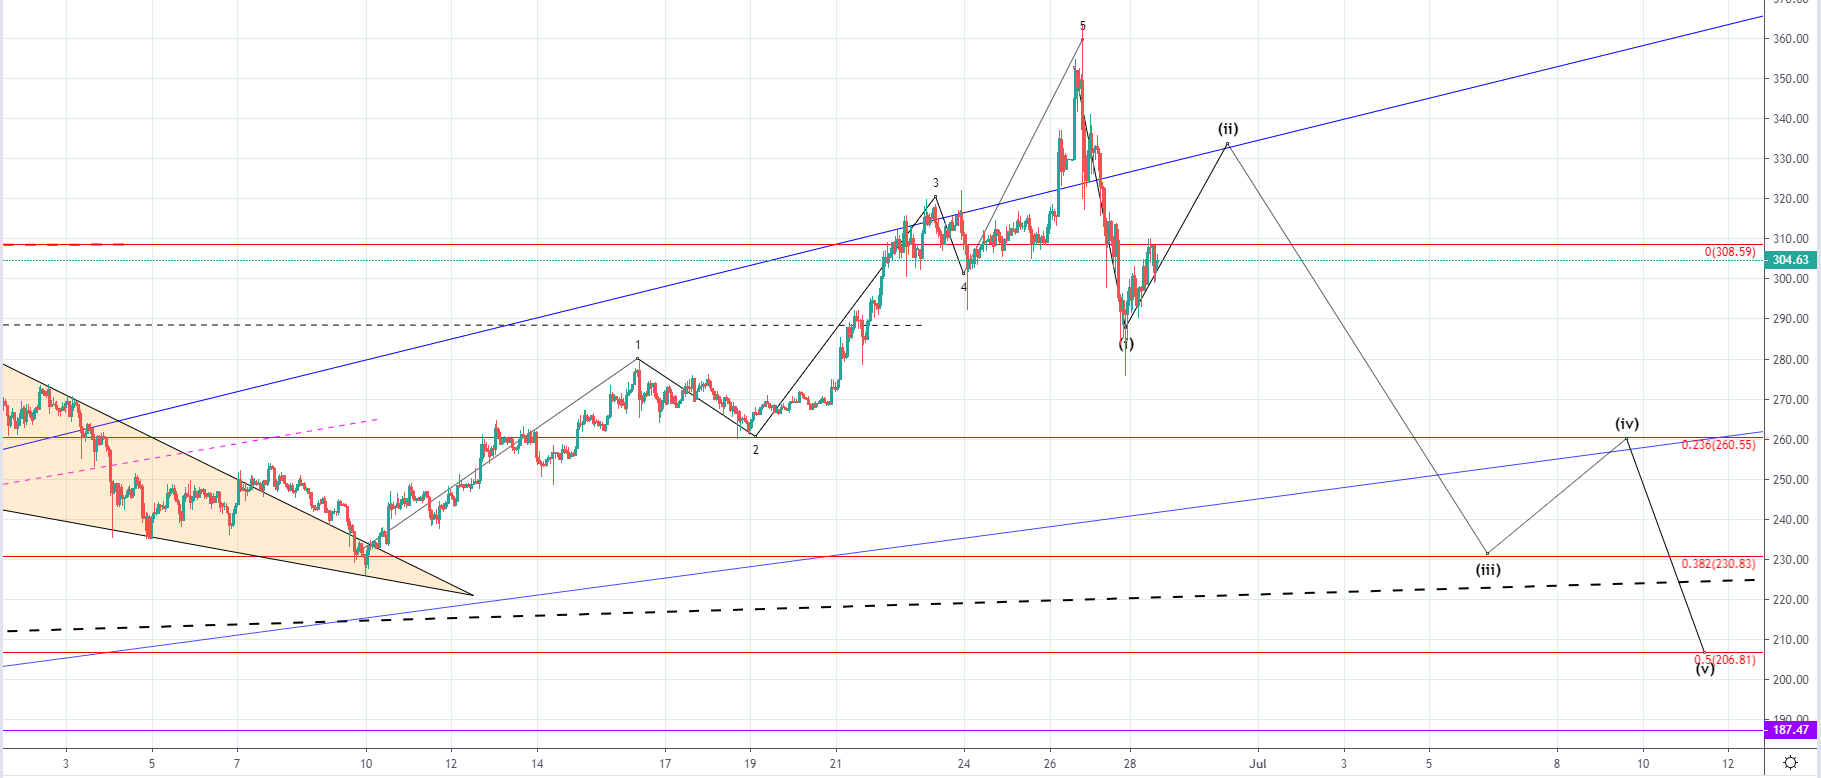
From yesterday’s high at $336.1 the price of Ethereum has decreased by over 18% measured to the lowest spike the price has been which is at $275.45, but the hourly candle closed above $290.7.
The price is currently being traded at around $304 and was in an upward trajectory until it reached the significant Fibonacci level at $308.59 where it found resistance on the interaction.
As a rejection occurred the price has started moving to the downside again and looking at the hourly chart you can see that its minor uptrend line still hasn’t been broken.
The increase still might continue to the significant ascending trendline which was broken but the price fell immediately inside the territory of the ascending channel, ending as a fakeout. This is why the level might get retested again on the current recovery but we are yet to see how strong is the momentum behind today’s increase.
For now, it looks weak as the Fibonacci level was able to stop it out, so now that the price started moving to the downside we could see the price starting to move below the minor ascending trendline from today’s low.
Prior to the impulsive decrease, we have seen the completion of the five-wave impulse to the upside which could have been the ending wave of the higher degree with now a downturn starting to develop as the bullish period ended.
If we are seeing the development of the higher degree correction we are likely to see a five-wave move to the downside in an impulsive manner which would only be the first wave out of the potential three-wave move of the higher degree.
In that case, the price of Ethereum would be expected to go for a retest of some major resistance point, broken on the way up, out of which the first significant one would be between $187 and $174.
LTC/USD
From yesterday's high at $130.322 the price of Litecoin has decreased by 13% coming to $113.36 at its lowest point and even spiked further to the downside coming to $110.69 but the hourly candle closed above $133 leaving a wick on the hourly chart. The price is currently being traded at $117.69 slightly below today's high at $119.7 as a minor recovery has been made.  On the hourly chart, you can see that the price of Litecoin fell inside the territory of the lower horizontal range between the $122.32 level and the $109.356 horizontal pivot. This area is highly significant as it was considered to be the support area from the first half of the bear market and managed to hold the price of Litecoin but was eventually broken on the 10th of June 2018. Out of this support/resistance, the $137 horizontal level was its furthest level and considering that the interaction with it ended as rejection with an impulsive downside move seen after, we have likely seen a retest of the broken support for resistance before further downtrend continuation.
From 5th till 12th of June we have seen the development of the five-wave move to the upside which was most likely the ending wave of the higher degree as immediately after its completion we've seen a sideways range forming before a straight downfall. This impulsiveness to the downside indicates that the sellers are taking control. If we are seeing the development of the downtrend and from 26th its first wave in a five-wave manner the price is set to go below the last horizontal support level at $109 and would enter the lower range below the support zone.
If this occurs we could view it as a confirmation of the starting downtrend as the price of Litecoin was continuously increasing from 29th of April and made an increase of 112% without a major correctional movement. That this might not be a correction and instead of a starting downtrend we are yet to see from the development of the last move to the downside, but if it were to develop in a five-wave manner with the price going below the last horizontal level the possibility of the starting downtrend would increase significantly.
Conclusion
The cryptocurrency market has experienced a recovery today but the prices of the major cryptos have shown early signs of weakness around their first minor resistance points. We are yet to see if the recovery continues but as the impulsiveness was exhibited by the sellers in the last 24 hours I believe that the prices aren’t headed further up and that we are seeing the start of the downtrend.
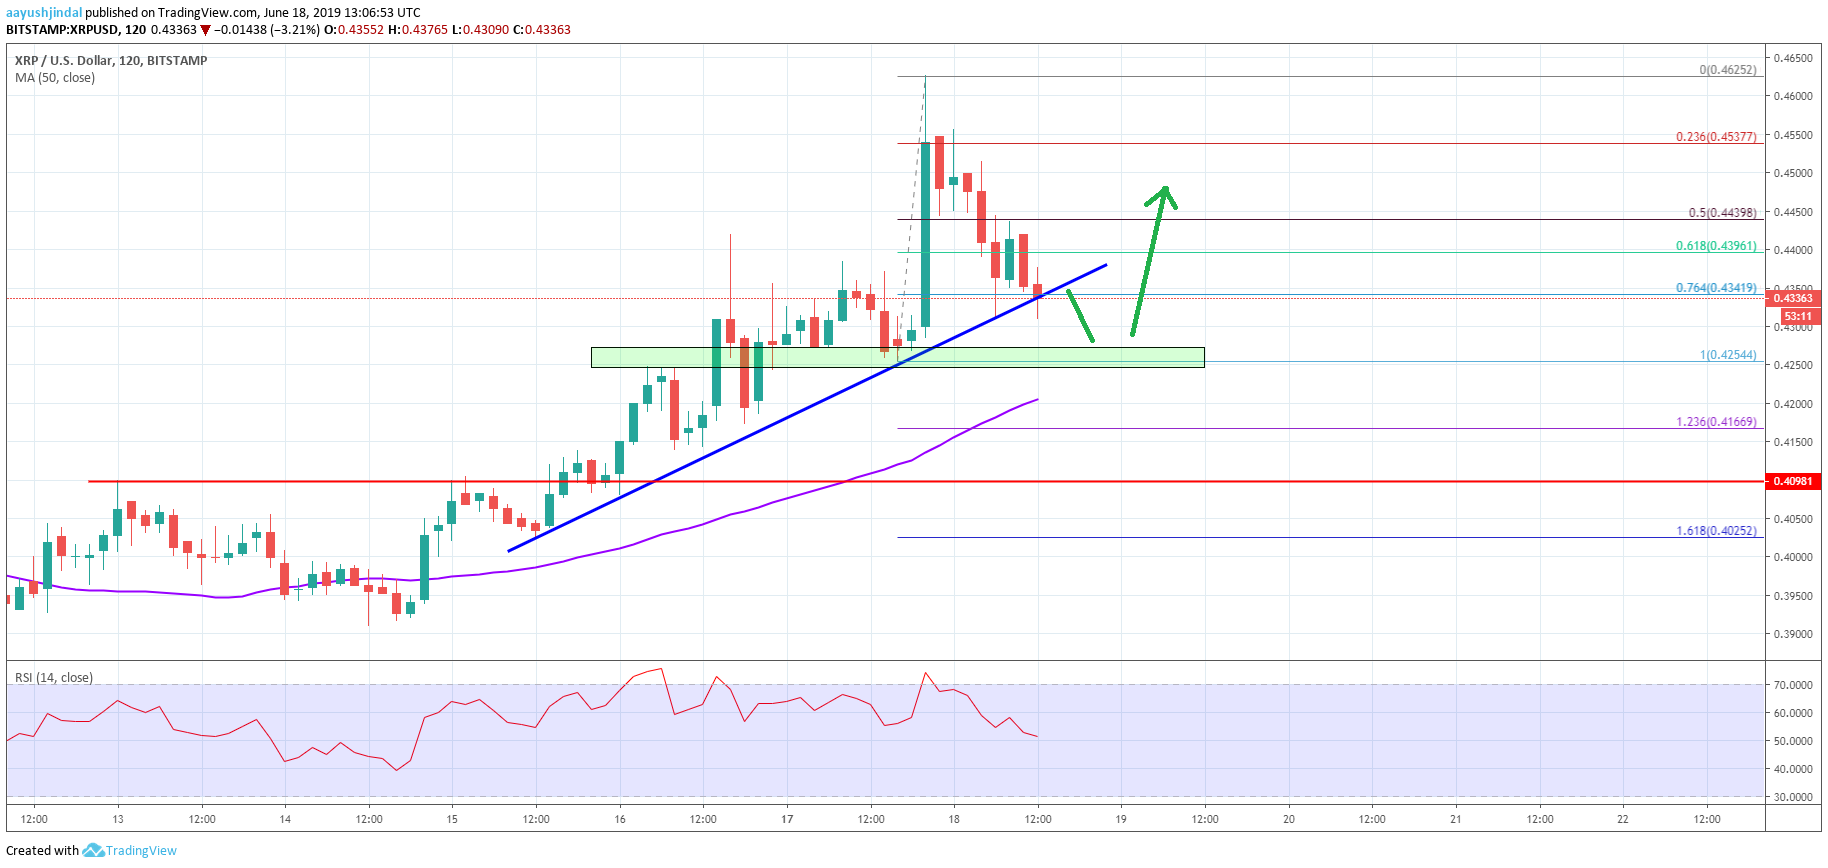
Ripple price surged higher recently above $0.4400 and $0.4600. XRP to USD is currently correcting lower, but the $0.4255 level is likely to act as a strong support and buy zone.
Key Takeaways: XRP/USD
- Ripple price traded to a new monthly high at $0.4625 and recently corrected lower against the US Dollar.
- XRP/USD is testing the $0.4320 support and a major bullish trend line on the 2-hours chart (data feed from Bitstamp).
- Bitcoin price is also correcting lower from well above $9,400 and Ethereum price is currently below $270.00.
Ripple Price Analysis
Earlier this week, bitcoin price extended gains above $9,300 and $9,400. It helped ripple and its price recently started a strong rise above the $0.4200, $0.4320 and $0.4400 resistance levels. XRP even broke the $0.4500 level and traded to a new monthly high.
Looking at the 2-hours chart, ripple price even traded above the $0.4600 level and settled well above the 50 simple moving average (2-hours, purple). A high was formed at $0.4625 and recently, the price started a sharp downside correction.
There was a break below the $0.4520 support and the 50% Fib retracement level of the recent wave from $0.4254 to $0.4625. Moreover, the price broke the $0.4400 support level.
It is currently testing the $0.4320 support and a major bullish trend line on the 2-hours chart. The 76.4% Fib retracement level of the recent wave from $0.4254 to $0.4625 is also acting as a support.
If there is a downside break, the price could test the main support near the $0.4255 level. As long as ripple price is above $0.4255, it is likely to bounce back in the near term.
An initial resistance is near the $0.4400 level, above which ripple is likely to continue higher towards the $0.4480 and $0.4500 levels. If the bulls regain strength, XRP price could even retest the $0.4625 swing high.
Overall, ripple price is trading with a strong bullish bias above $0.4255 and $0.4150. Therefore, there are high chances of a fresh increase above the $0.4400 and $0.4480 resistance levels in the coming sessions.

Bitcoin Price Starting to Recover After Sharp Drop; Top Alts Ethereum and Litecoin Are Struggling

Bitcoin (BTC), Ethereum (ETH), and Litecoin (LTC) Price Prediction for Today’s Top Cryptocurrencies

Ripple Price Analysis: XRP/USD Primed For Further Gains

Bitcoin Price Analysis: BTC Surging, Next Stop Could Be $9,750

Ethereum Price Analysis: ETH Approaching Significant Support Area

Bitcoin Price Analysis: BTC Setting Up For Another Bull Run

Crypto Media Site CCN Announces It’s Shutting Down After Latest Google Update

Bitcoin (BTC), Ethereum (ETH), Litecoin (LTC) and Bitcoin Cash (BCH) Price Analysis June 10th

Facebook and the CFTC Discuss The Future of the GlobalCoin
