Bitcoin (BTC)
Bitcoin (BTC): Live Coin Prices, Top Exchanges, Best Wallets & News

What Is Bitcoin BTC?
The banking crisis of late 2000s had many deleterious economic effects but it also sowed seeds for a new economic system without banks. In his seminal paper which was emailed to the Cryptography mailing list (a group of cypherpunks), the pseudonymous founder, Satoshi Nakamoto proposed Bitcoin as a “new electronic cash system that's fully peer-to-peer, with no trusted third party.”
“A purely peer-to-peer version of electronic cash would allow online payments to be sent directly from one party to another without the burdens of going through a financial institution. Digital signatures provide part of the solution, but the main benefits are lost if a trusted party is still required to prevent double-spending. We propose a solution to the double-spending problem using a peer-to-peer network. The network timestamps transactions by hashing them into an ongoing chain of hash-based proof-of-work, forming a record that cannot be changed without redoing the proof-of-work. The longest chain not only serves as proof of the sequence of events witnessed, but proof that it came from the largest pool of CPU power. As long as honest nodes control the most CPU power on the network, they can generate the longest chain and outpace any attackers. The network itself requires minimal structure. Messages are broadcasted on a best effort basis, and nodes can leave and rejoin the network at will, accepting the longest proof-of-work chain as proof of what happened while they were gone.”
The proposal was initially met with much skepticism, with fellow cypherpunks raising concerns over scalability and centralization risk, among other things. Nonetheless, it was the first digital cash system to solve the double-spending problem and thus, a revolution was born.
What Is A Blockchain?
A blockchain is an immutable, distributed public ledger consisting of a chronological sequence of data sets (blocks) shared by every node (computer) on the network. It is at the core of the bitcoin network and stores all transactions made on the network. Since every node possesses a copy of the blockchain, no single node or a group of nodes is in control and the data cannot be retroactively falsified.
Addresses
A Bitcoin public address represents the destination of a bitcoin payment, consisting of 26-35 alphanumeric characters. They begin with either the number 1 or 3 – P2PKH address formats begin with 1 and the newer P2SH formats begin with 3.
Addresses are case-sensitive and cannot include uppercase letter “O”, uppercase letter “I”, lowercase letter “l”, and the number “0” to prevent ambiguity.
Private key
The private key is a 256-bit hexadecimal number used to spend bitcoins from a public address. While a public address is visible to anyone on the network, the corresponding private key is known only to the owner of a wallet. Knowing the private key to an address allows anyone to spend bitcoins from that address and is therefore imperative that private key be kept secret and secure.
Transactions
All transactions are stored on the blockchain through one-way encryption using a mathematical algorithm (hash function) which maps data to a bit string (hash). Hash is a string of numbers and letters that serves to verify data validity without explicitly revealing the data.
Bitcoin transactions have inputs and outputs. Input is the bitcoin address, corresponding hashed signature (using private key) and the amount of bitcoin contained within an address. Output consists of the amount of bitcoin being sent to the recipient's address and UTXO (unspent transaction output) which is returned to the sender's wallet and can be used as an input in a new transaction. Each transaction references previous transaction output as the new input.
Confirmations
For a transaction to become valid on the bitcoin network, it requires confirmation through a process known as Proof of Work (PoW). After a transaction is broadcast to the network, it is included in a block by miners who verify the authenticity of the data. A block is generated roughly every 10 minutes.
When a transaction is included in a block, it is said to have one confirmation. With each further block built on top of the block containing a transaction, the number of confirmations increase by one. Transactions with more than 2 confirmations are said to be sufficiently secure from attacks altering the course of the blockchain.
Proof of Work (PoW)
In order to prevent tampering with the blockchain/ledger, Bitcoin uses a protocol known as Proof of Work (PoW) to achieve consensus. This requires nodes on the network known as miners to generate a corresponding hash function for a set of transactions below a given target. The hash is a one-way function: it cannot be used to obtain the original data, only to check that the data that generated the hash matches the original data. Even the slightest change to a set of data drastically changes resulting hash function.
Bitcoin network calibrates the difficulty for finding the target to ensure that a new block is generated roughly every 10 minutes. The lower this target, fewer the valid hashes and higher the difficulty of finding a valid hash. The SHA-256 hashes begin with a string of zeros. For miners, computing a valid hash entails a trial and error process of adding an integer value called a nonce to the base string and incrementing it each time. Once a miner computes a valid hash, it is broadcast to the network and the generated block is added to the blockchain.
Miners are rewarded for their work with both the transaction fees contained within the block and newly generated bitcoins known as block reward. Block reward halves every 210,000 blocks (roughly every 4 years). At this rate, all 21 million bitcoins will be released by 2140, after which miners' reward for securing the network will consist exclusively of transaction fees.
SegWit
Formulated by Dr. Pieter Wuille, Segregated Witness (SegWit) is an implementation which changed the transaction format for bitcoin transactions by removing signature data from the original portion and appending it as a separate structure at the end. As the signature data accounts for 65% of space in a transaction, this increases the space available for transactions within a block, thereby allowing transactions to be processed faster. Bitcoin blocks are 1 mb in size. SegWit effectively increases the size four-fold.
In addition, Segwit also addresses transaction malleability, which is an exploit where a receiver could intercept and modify the sender’s transaction ID in a bid to get more coins from the sender. With the signature data removed from the input, it is impossible for an unscrupulous party to modify the transaction ID.
Lightning Network
Blockchains are inherently difficult to scale on-chain. The means to scalability has been a contentious point of debate for a few years within the bitcoin community. Off-chain state channels offer the most secure and sustainable solution.
Lightning Network allows users on the network to make numerous transactions without broadcasting on the blockchain via state channels on the secondary layer. Opening a payment channel, however, requires a funding transaction which is performed on the blockchain.
Once a channel is open, any number of transactions can occur between participants, with each transaction updating the state or allocation of funds. Only the most recent state is valid.
Payment on the Lightning Network is secured using smart-contract scripting which is enforceable on the blockchain. Uncooperative participants are penalized using time-locked smart contract functionalities.

Price Analysis
Bitcoin Price Starting to Recover After Sharp Drop; Top Alts Ethereum and Litecoin Are Struggling

Bitcoin BTC/USD Forecasting
From yesterday's open at $12317 the price of Bitcoin increased to $12761 but then fell below its opening price as it came down to $12100 level. After this retracement, the start of another rise has been seen with the price reaching $13055 at its highest point today before falling nearly $800 in an hour.
The price momentum has been stopped out after an increase of 7.76% measured from yesterday's low at $12100 as the price started encountering resistance around the vicinity of the prior high on the ending point of the 5th wave of the upward impulse.
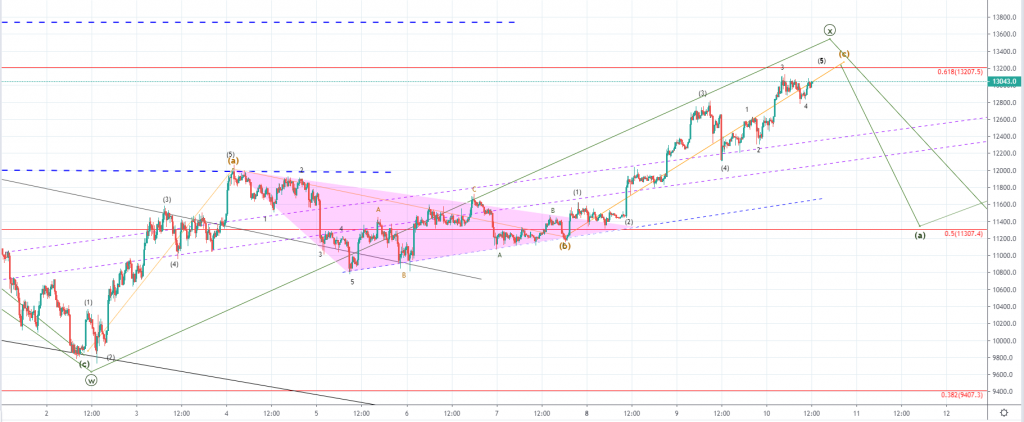
Looking at the 15 min chart, you can see that the price got close to the 0.618 Fib level but there hasn't been an interaction before the price found resistance and has started to flat out, forming a horizontal resistance point. As we are seeing the ending wave of the five-wave impulse its further development would be expected to end around the vicinity of the 0.618 Fib level and proper interaction with the price potentially exceeding it on the spike up.
This would be the completion of the five-wave impulse which started on the 7th of July and is the third wave out of the upward structure from the 2nd of July. Previous to the five-wave increase a corrective triangle has been seen forming which was according to my count the B wave out of the upward ABC three-wave move. This three-wave move would be the X wave of the higher degree count which is why after its completion which is set to develop very shortly I would be expecting a move to the downside as the third wave Y should develop.
Another possibility would be that the correction ended on the first three-wave move which are only the sub-waves of the W wave according to the current count. If that is true, then we could be seeing the development of another five-wave move instead of the three-wave ABC correction to the upside. In either way, from here I would be expecting a move to the downside and if the price falls below the lower interrupted blue horizontal level on the retracement I would indicate that the move to the upside has ended on the third wave and is corrective and not impulsive.
Ethereum ETH/USD Forecasting
From yesterday’s high at $317.62 the price of Ethereum has decreased by 4.61% measured to its lowest point today which is at $302.98. The price has recovered since and came up to around $314 after, but is currently being traded at $309.
Looking at the 15 min chart, you can see that the price is currently retesting the 0 Fib level for support as a minor breakout above occurred. The price is likely to find support at the present levels as a breakout occurred on the prior high as well and has shown the absence of strong seller’s pressure.
As we are seeing the development of a five-wave impulse to the upside from 5th of July its ending wave’s development would now likely mean further increase but only for a short while as the next significant horizontal level is getting close. This is the ending point of the prior high and the support point of the impulsive move’s ending point and now serves as significant resistance.
If we are seeing a three-wave ABC to the upside out of which the mentioned five-wave impulse from the 5th of July is the C wave, the price is set to start moving to the downside after its completion, below the ending point of the first ABC to the downside which is at $276.
Upward ABC would be the second wave out of the higher degree three-wave correction which is why the third one would be expected to end on a lower low compared to the first ABC correction which would be its first wave. The most optimal target point of the expected decrease would be around the intersection of the lower ascending level which represents an uptrend support level and the 0.236 Fib level which is at $260.5.
There is a possibility that instead of the price ending its increase from the 5th of July on the third wave, we see it developing in a five-wave manner which will indicate impulsiveness instead of the currently presumed corrective momentum.
In that case, the price of Ethereum cannot go below $296 which is the territory of the 2nd wave on which the price cannot enter on the 4th if we are seeing a five-wave increase which is why the level is serving as a significant pivot point.
Litecoin LTC/USD Forecasting
From yesterday's high at $124.6 the price of Litecoin decreased by 5.37% as it came down to $117.9 at its lowest point today. The price came down to the same low level after a recovery attempt has been stopped out at $119.95, but the price is currently being traded around $119.180.
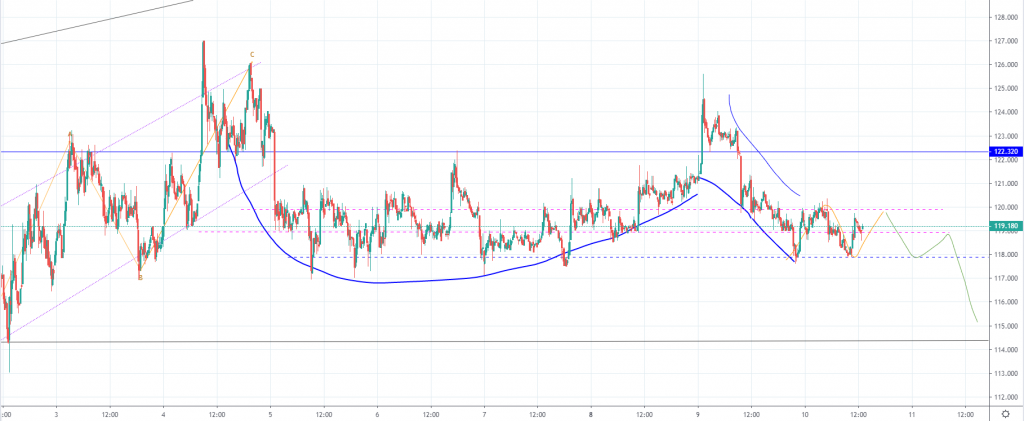 On the 15 min chart, you can see that the price of Litecoin came down to the first significant horizontal support level which is the lower outline level off of the horizontal range in which the price action is bouncing from 5th of July. Including the price action from the day before we have seen the formation of a cup and handle pattern with the price continuing to form the handle structure from yesterday's spike abode the significant horizontal level at $122.32 which is considered as the median point of the higher degree resistance range.
As the price failed to keep up the upward momentum and instead left a spike to the upside falling down fast below the significant horizontal level indicating strong resistance is present above, we have seen a retest of the lowest support level from the mentioned pattern. The price has recovered slightly but again failed to exceed the median point of the horizontal range from 5th which got broken in the second half of yesterday's trading session.
The recovery has developed a retest of the median point and another retest of the support level from the horizontal range with the price currently holding above its half range line. I would be expecting another minor increase which could be another retest of the today's high after which another downfall below today's support level. Even though the handle still hasn't been broken we have seen the price retracing back to the cup's support level which could be viewed as a breakout.
In either way, I would be expecting a retest of the $114.31 horizontal level which was low from the 2nd of July and was the ending point of the five-wave impulse to the downside after which a corrective ABC to the upside has been seen. This is why I think that a breakout from the downside would lead to the formation of another impulsive move which would set to push the price of Litecoin back inside the lower range below the resistance zone at $109.
Conclusion
The price’s of the major cryptos are starting to reach their significant resistance point on the corrective increase whos continuation we’ve seen in the last 24 hours. As the prices are approaching their signifiant resistance levels, after an interaction I would be expecting another downturn in the market.
Price Analysis
Bitcoin (BTC), Ethereum (ETH), and Litecoin (LTC) Price Prediction for Today’s Top Cryptocurrencies

BTC/USD
From yesterday's high at $13212 the price of Bitcoin decreased by 21.23% as it came down to $10407 at its lowest point today. Yesterday's high was an interaction with the significant 0.618 Fibonacci level which ended as a rejection and caused the price to start moving to the downside in an impulsive manner.
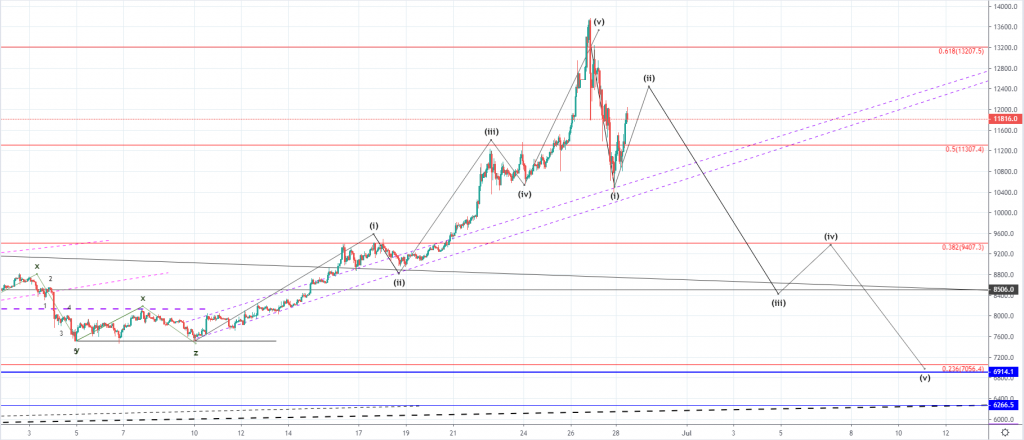 Looking at the hourly chart you can see that the price came below the 0.5 Fibonacci level and stopped out at the minor ascending trendline from the from 10th of June from when the last five-wave impulse started developing. As the price found support there an immediate recovery has started which managed to pull the price back above the 0.5 Fib level and is currently being traded at $118816, slightly below today's high at $12012.
The price recovered by over 14% today measured to the lowest spike to the highest point today but it appears that strong resistance has been encountered as indicated by the last hourly candle. This recovery appears to be correctional and is most likely the 2nd wave out of the starting downtrend. I wouldn't expect it to go above $12451 which would be a 0.618 Fib from the impulsive decrease if the corrective movement is in play.
We've seen the completion of the five-wave impulse from 10th of June which could have been the 5th wave from the higher degree count which I believe that it was. If this is true, then we are going to see further downside for the price of Bitcoin in the upcoming period as a correction of the same degree should develop.
On the hourly chart, you can see that I've projected a target to around $6914 but the price of Bitcoin could go significantly lower as it would be only the first wave to the downside. The five-wave move might not develop and we could instead see a three-wave correction to $8500 before further upside continuation but considering the seller's momentum seen from yesterday, I don't believe that Bitcoin's price is going to continue increasing further.
ETH/USD
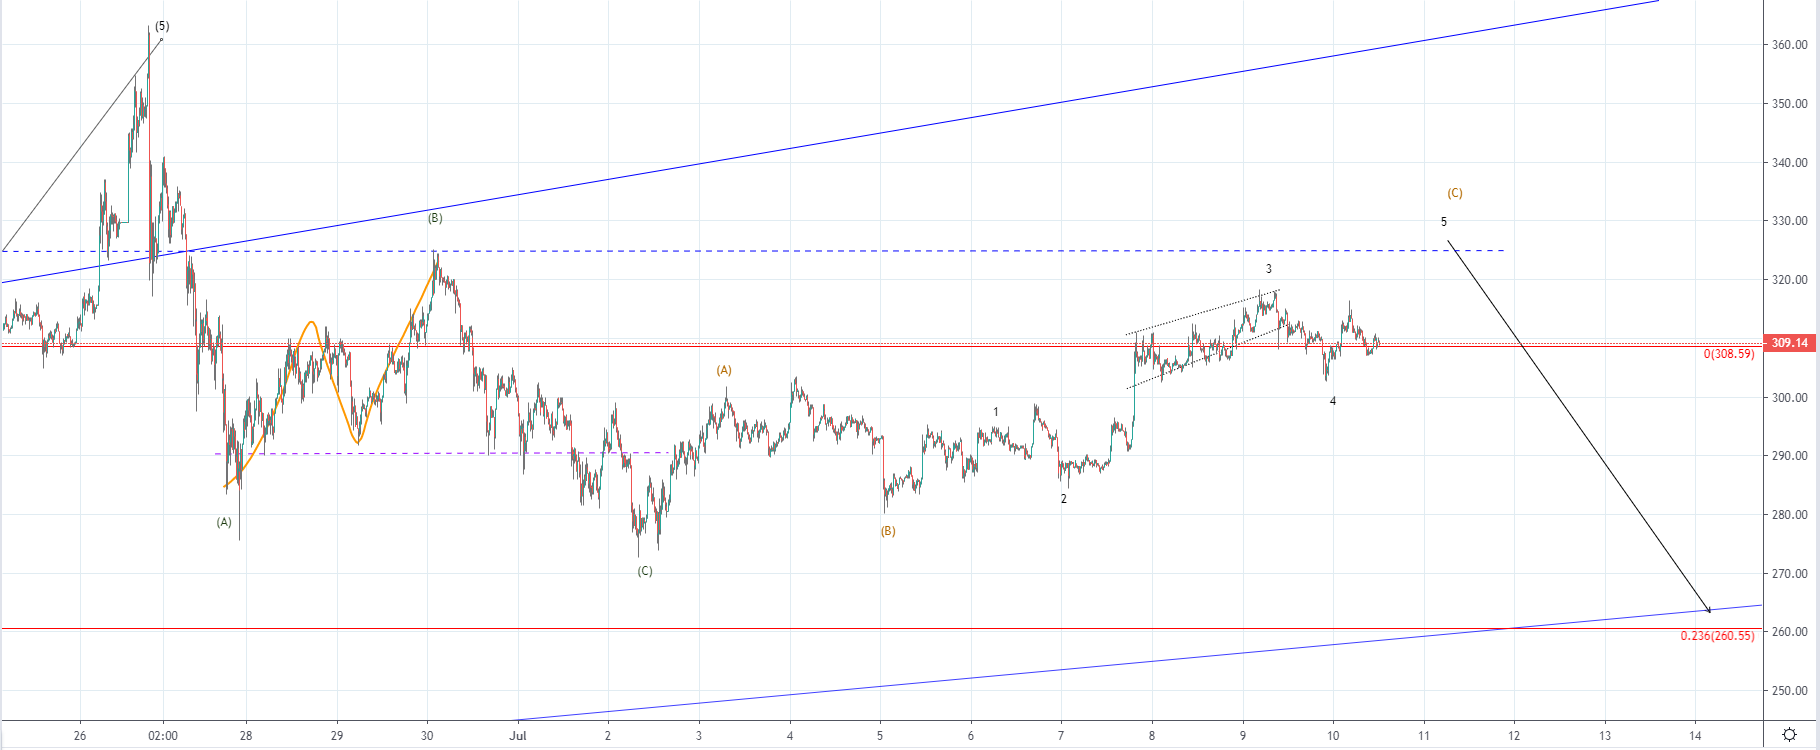
From yesterday’s high at $336.1 the price of Ethereum has decreased by over 18% measured to the lowest spike the price has been which is at $275.45, but the hourly candle closed above $290.7.
The price is currently being traded at around $304 and was in an upward trajectory until it reached the significant Fibonacci level at $308.59 where it found resistance on the interaction.
As a rejection occurred the price has started moving to the downside again and looking at the hourly chart you can see that its minor uptrend line still hasn’t been broken.
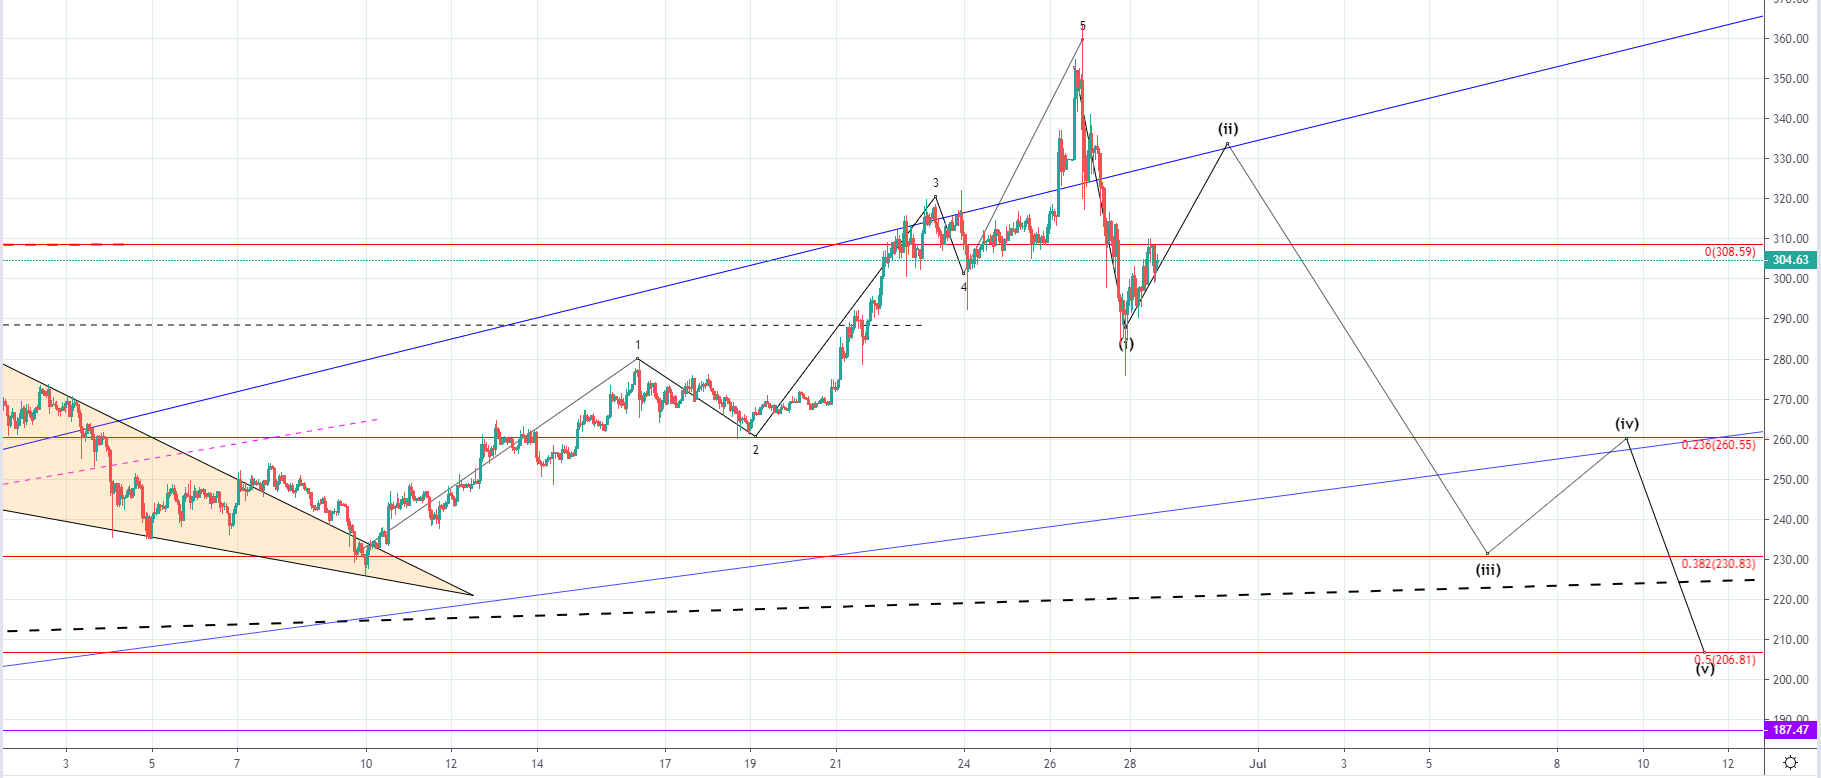
The increase still might continue to the significant ascending trendline which was broken but the price fell immediately inside the territory of the ascending channel, ending as a fakeout. This is why the level might get retested again on the current recovery but we are yet to see how strong is the momentum behind today’s increase.
For now, it looks weak as the Fibonacci level was able to stop it out, so now that the price started moving to the downside we could see the price starting to move below the minor ascending trendline from today’s low.
Prior to the impulsive decrease, we have seen the completion of the five-wave impulse to the upside which could have been the ending wave of the higher degree with now a downturn starting to develop as the bullish period ended.
If we are seeing the development of the higher degree correction we are likely to see a five-wave move to the downside in an impulsive manner which would only be the first wave out of the potential three-wave move of the higher degree.
In that case, the price of Ethereum would be expected to go for a retest of some major resistance point, broken on the way up, out of which the first significant one would be between $187 and $174.
LTC/USD
From yesterday's high at $130.322 the price of Litecoin has decreased by 13% coming to $113.36 at its lowest point and even spiked further to the downside coming to $110.69 but the hourly candle closed above $133 leaving a wick on the hourly chart. The price is currently being traded at $117.69 slightly below today's high at $119.7 as a minor recovery has been made.  On the hourly chart, you can see that the price of Litecoin fell inside the territory of the lower horizontal range between the $122.32 level and the $109.356 horizontal pivot. This area is highly significant as it was considered to be the support area from the first half of the bear market and managed to hold the price of Litecoin but was eventually broken on the 10th of June 2018. Out of this support/resistance, the $137 horizontal level was its furthest level and considering that the interaction with it ended as rejection with an impulsive downside move seen after, we have likely seen a retest of the broken support for resistance before further downtrend continuation.
From 5th till 12th of June we have seen the development of the five-wave move to the upside which was most likely the ending wave of the higher degree as immediately after its completion we've seen a sideways range forming before a straight downfall. This impulsiveness to the downside indicates that the sellers are taking control. If we are seeing the development of the downtrend and from 26th its first wave in a five-wave manner the price is set to go below the last horizontal support level at $109 and would enter the lower range below the support zone.
If this occurs we could view it as a confirmation of the starting downtrend as the price of Litecoin was continuously increasing from 29th of April and made an increase of 112% without a major correctional movement. That this might not be a correction and instead of a starting downtrend we are yet to see from the development of the last move to the downside, but if it were to develop in a five-wave manner with the price going below the last horizontal level the possibility of the starting downtrend would increase significantly.
Conclusion
The cryptocurrency market has experienced a recovery today but the prices of the major cryptos have shown early signs of weakness around their first minor resistance points. We are yet to see if the recovery continues but as the impulsiveness was exhibited by the sellers in the last 24 hours I believe that the prices aren’t headed further up and that we are seeing the start of the downtrend.
In the past few days, there were strong gains in bitcoin price above $9,000. BTC to USD is surging and it seems like it could even trade towards the $9,750 or $9,800 level in the near term.
Key Takeaways: BTC/USD
- Bitcoin price is surging higher and is positioned nicely above the $9,000 level against the US Dollar.
- BTC/USD broke a crucial barrier near $9,200 and a contracting triangle resistance on the 2-hours chart (data feed from Bitstamp).
- Ethereum, ripple, and bitcoin cash also gaining traction and moving higher.
Bitcoin Price Analysis
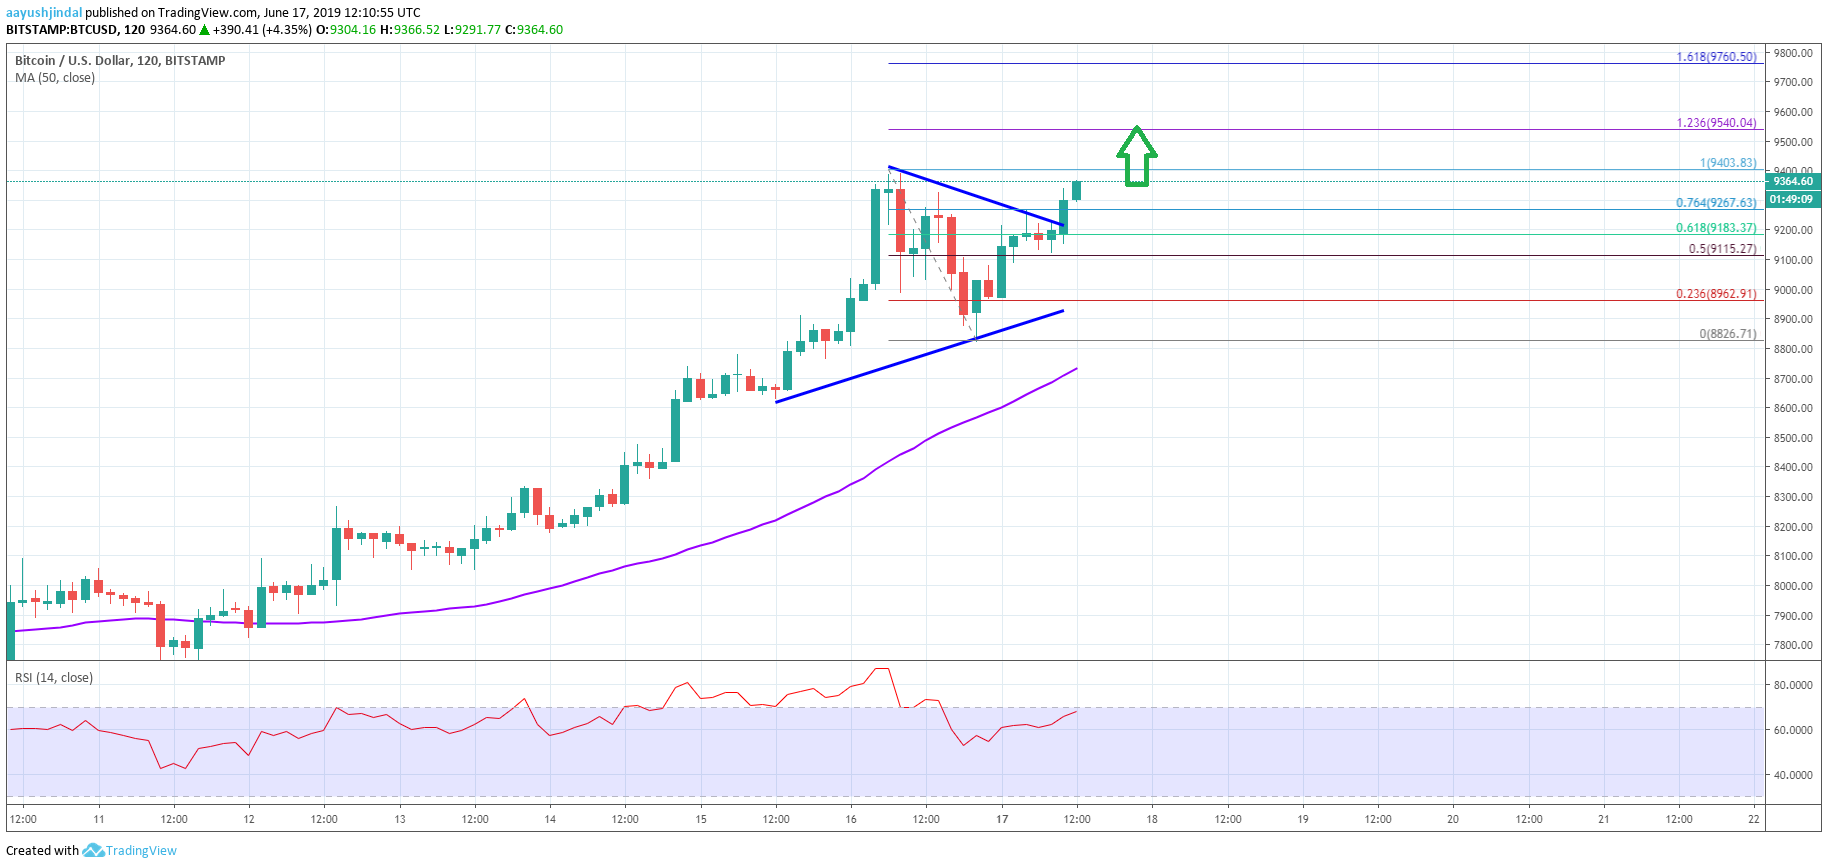
After setting above the $8,500 resistance, bitcoin price started a strong upward move. BTC surpassed many hurdles near the $8,850 and $9,000 levels to continue higher in the past few sessions.
Looking at the 2-hours chart, bitcoin even settled above the $9,100 level and the 50 simple moving average (2-hours, purple). The bulls gained traction and the price recently traded to a new 2019 high at $9,403.
It corrected lower from $9,403 and declined below the $9,200 and $9,100 levels. However, the price found support near $8,825 and it remained well above the 50 simple moving average (2-hours, purple).
Recently, it climbed back above $9,100 and broke a crucial barrier near $9,200 plus a contracting triangle resistance on the same chart. It is now trading above the 76.4% Fib retracement level of the recent correction from $9,403 to $8,826.
An immediate resistance is near the last swing high at $9,400, above which the price could accelerate towards the $9,500 and $9,550 levels.
The main resistance above $9,500 is near the $9,750 level. The 1.618 Fib extension level of the recent correction from $9,403 to $8,826 is near the $9,750 level. Above $9,750, the bulls are likely to target the key $10K level.
On the downside, an initial support for bitcoin price is near the $9,200 level. If there is a fresh downside correction, BTC to USD might retest the $9,000 pivot level. If there are more losses, the downside extension could lead the price towards the $8,800 or $8,750 level. Overall, BTC price is likely to accelerate towards $9,750 or $10K.

Bitcoin Price Starting to Recover After Sharp Drop; Top Alts Ethereum and Litecoin Are Struggling

Bitcoin (BTC), Ethereum (ETH), and Litecoin (LTC) Price Prediction for Today’s Top Cryptocurrencies

Ripple Price Analysis: XRP/USD Primed For Further Gains

Bitcoin Price Analysis: BTC Surging, Next Stop Could Be $9,750

Ethereum Price Analysis: ETH Approaching Significant Support Area

Bitcoin Price Analysis: BTC Setting Up For Another Bull Run

Crypto Media Site CCN Announces It’s Shutting Down After Latest Google Update

Bitcoin (BTC), Ethereum (ETH), Litecoin (LTC) and Bitcoin Cash (BCH) Price Analysis June 10th

Facebook and the CFTC Discuss The Future of the GlobalCoin
