Ethereum (ETH)
Ethereum Price Analysis: ETH Smashes Resistance, Dips Remain Supported
After a sharp rise in bitcoin price, Ethereum price joined the party and rallied above the $230.00 and $250.00 resistances. ETH tested $274.00 and it is currently correcting lower towards key supports.
Key Takeaways: ETH/USD
- Ethereum price surged higher in the past few sessions above $230.00 and $250.00 against the US Dollar.
- ETH/USD is trading above the $244.00 support and a bullish trend line on the 2-hours chart (data feed from Bitstamp).
- XLM and ETC performed really well, with gains more than 15%.
Ethereum Price Analysis
Earlier bitcoin price started a strong uptrend, and then bitcoin cash, ripple and Ethereum gained bullish momentum. ETH price formed a solid support base near the $200.00 level and recently climbed more than 25%.
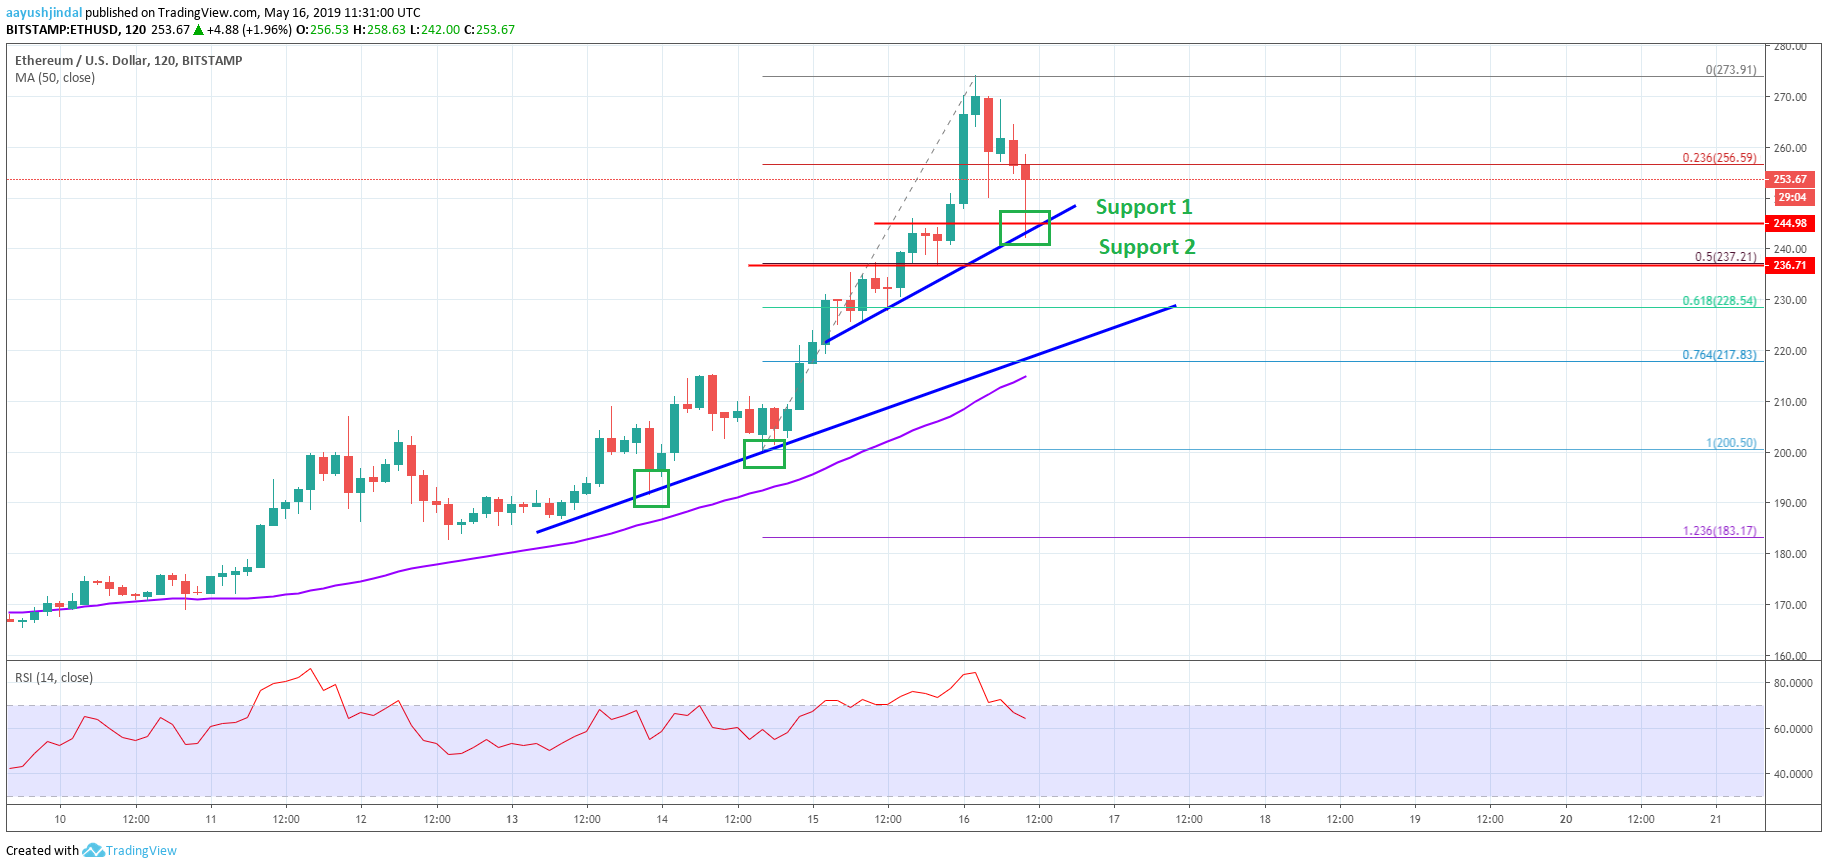
Looking at the 2-hours chart, Ethereum price settled above the key $200.00 and $210.00 pivot levels. It sparked a sharp rally above the $230.00 resistance and the price settled well above the 50 simple moving average (2-hours, purple).
The upward move was such that the price even broke the $250.00 and $265.00 resistance levels. A new 2019 high was formed at $273.91 and recently the price started a downside correction.
It broke the $265.00 support and traded below the 23.6% Fib retracement level of the rally from $200.50 to $273.91. However, the recent resistance zone near the $245.00 and $244.00 levels acted as a support and prevented further losses.
Besides, the price is trading above the $244.00 support and a bullish trend line on the same chart. If there is a break below the trend line support, the price could test the next support at $237.00 and the 50% Fib retracement level of the rally from $200.50 to $273.91.
The next important support is near the $228.00 level and another bullish trend line on the same chart. On the upside, Ethereum price could face resistance near the $260.00 and $265.00 levels. If ETH successfully climbs above $265.00 once again, there could be another strong rally above the $275.00 and $280.00 levels.
In the mentioned bullish case, the next stop for Ether buyers might be $292.00 or even $300.00 in the near term.
There was another rejection noted near $265.00 in Ethereum vs the US Dollar. ETH/USD is currently declining and approaching towards a couple of important supports near $254.00 and $250.00.
Key Takeaways: ETH/USD
- Ethereum price formed a short term top near the $264.4 level and declined against the US Dollar.
- ETH/USD is currently approaching the $254.00 support and a bullish trend line on the 2-hours chart (data feed from Bitstamp).
- Bitcoin price remains in an uptrend and it could accelerate gains above the $8,300 level.
Ethereum Price Analysis
Recently, bitcoin price gained momentum and broke the $8,100 and $8,200 resistance levels. However, Ethereum price failed to gain traction and formed a short term top near the $264.4 level.
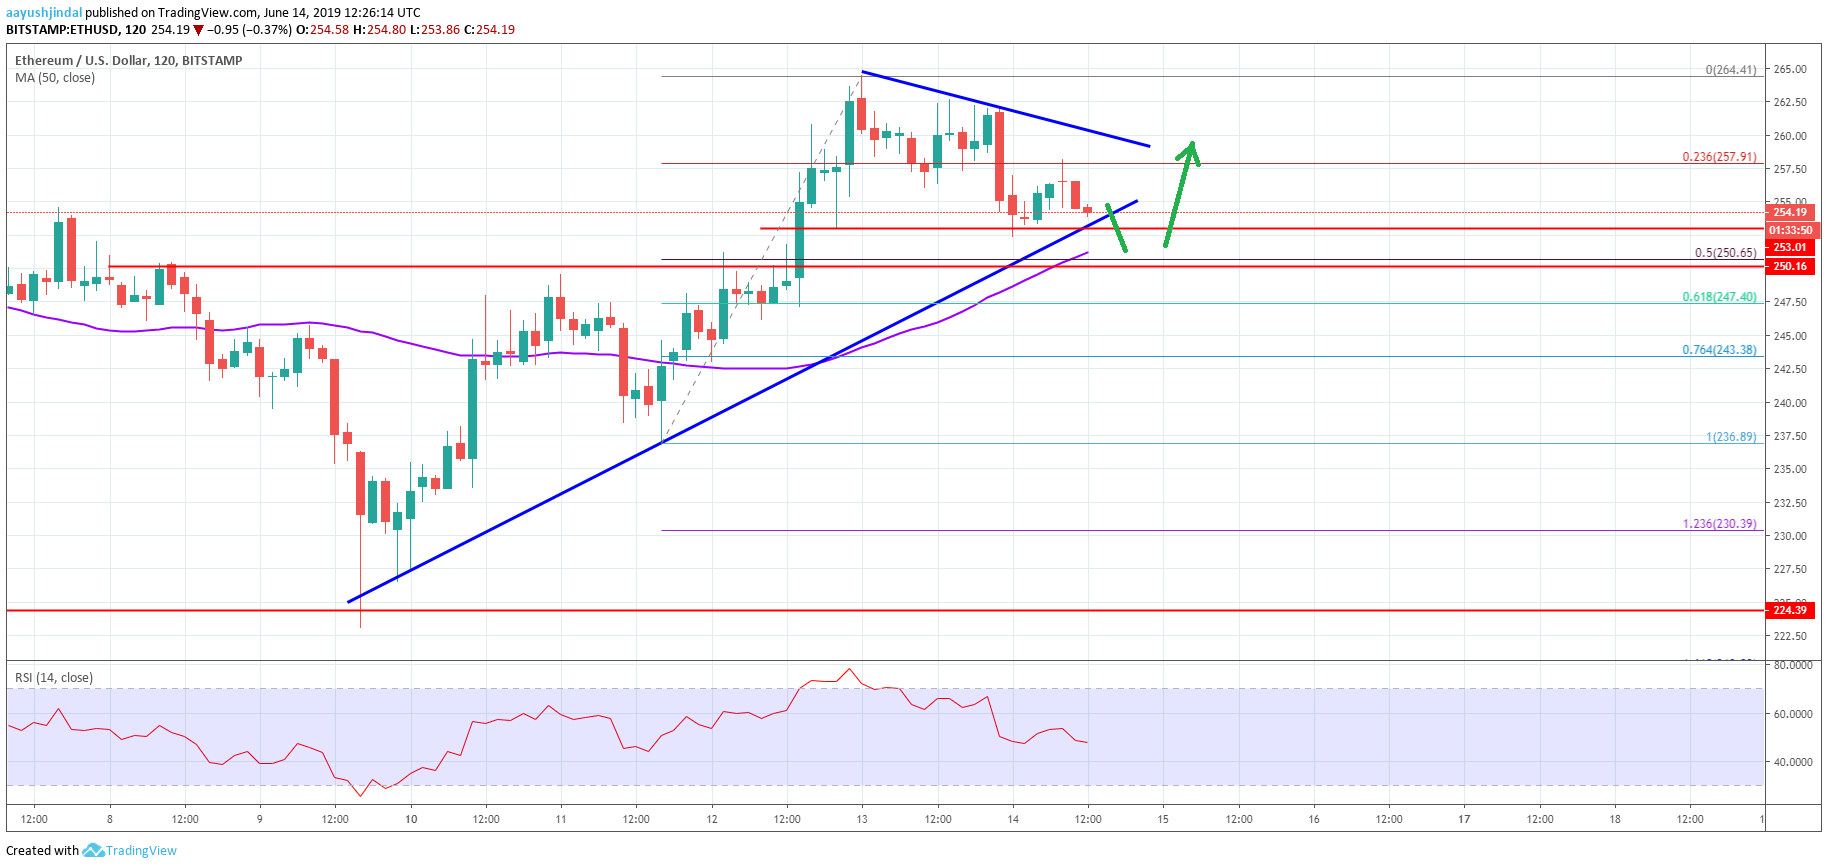
Looking at the 2-hours chart, Ethereum price started a downside correction from the $264.41 high and declined below the $260.00 level. There was a break below the 23.6% Fib retracement level of the last rally from the $236.89 to $264.41.
Besides, there was a break below the $258.00 level, but the price found support near $255.00. Moreover, the price is approaching the $254.00 support and a bullish trend line on the 2-hours chart.
Below the trend line, the main support is near the $250.20 level and the 50 simple moving average (2-hours, purple). The 50% Fib retracement level of the last rally from the $236.89 to $264.41 is also near the $250.65 level to act as a support.
If there is a downside break below the $250.00 support, the price could extend losses and decline towards the $243.50 zone. The 76.4% Fib retracement level of the last rally from the $236.89 to $264.41 is also near $243.40.
Conversely, if the trend line support holds, the price is likely to start a fresh increase in the coming sessions. An initial resistance is near $260.00 and a connecting bearish trend line. A break above the $260.00 barrier might start a strong rally in Ethereum price above the $265.00 level.
Overall, ETH price is trading with a positive bias as long as it is above $250.00, and it could rise again above $260.00 and $265.00.
Recently, there was a sharp dip in bitcoin and Ethereum. ETH/USD declined below the $265.00 support area, but the $258.00 area acted as a strong buy zone and the price is currently sighting important bullish break.
Key Takeaways: ETH/USD
- Ethereum price jumped sharply after testing the $258.00 support area against the US Dollar.
- ETH/USD is currently trading near the $272.00 resistance and below a major bearish trend line on the 2-hours chart (data feed from Bitstamp).
- Bitcoin price is back above the $8,650 level, but facing hurdles near $8,720 and $8,750.
Ethereum Price Analysis
Recently, bitcoin price started a downside correction below $8,700. Similarly, there was a downward move in Ethereum price below the $270.00 and $265.00 support levels, but the $258.00 level acted as a strong buy zone.
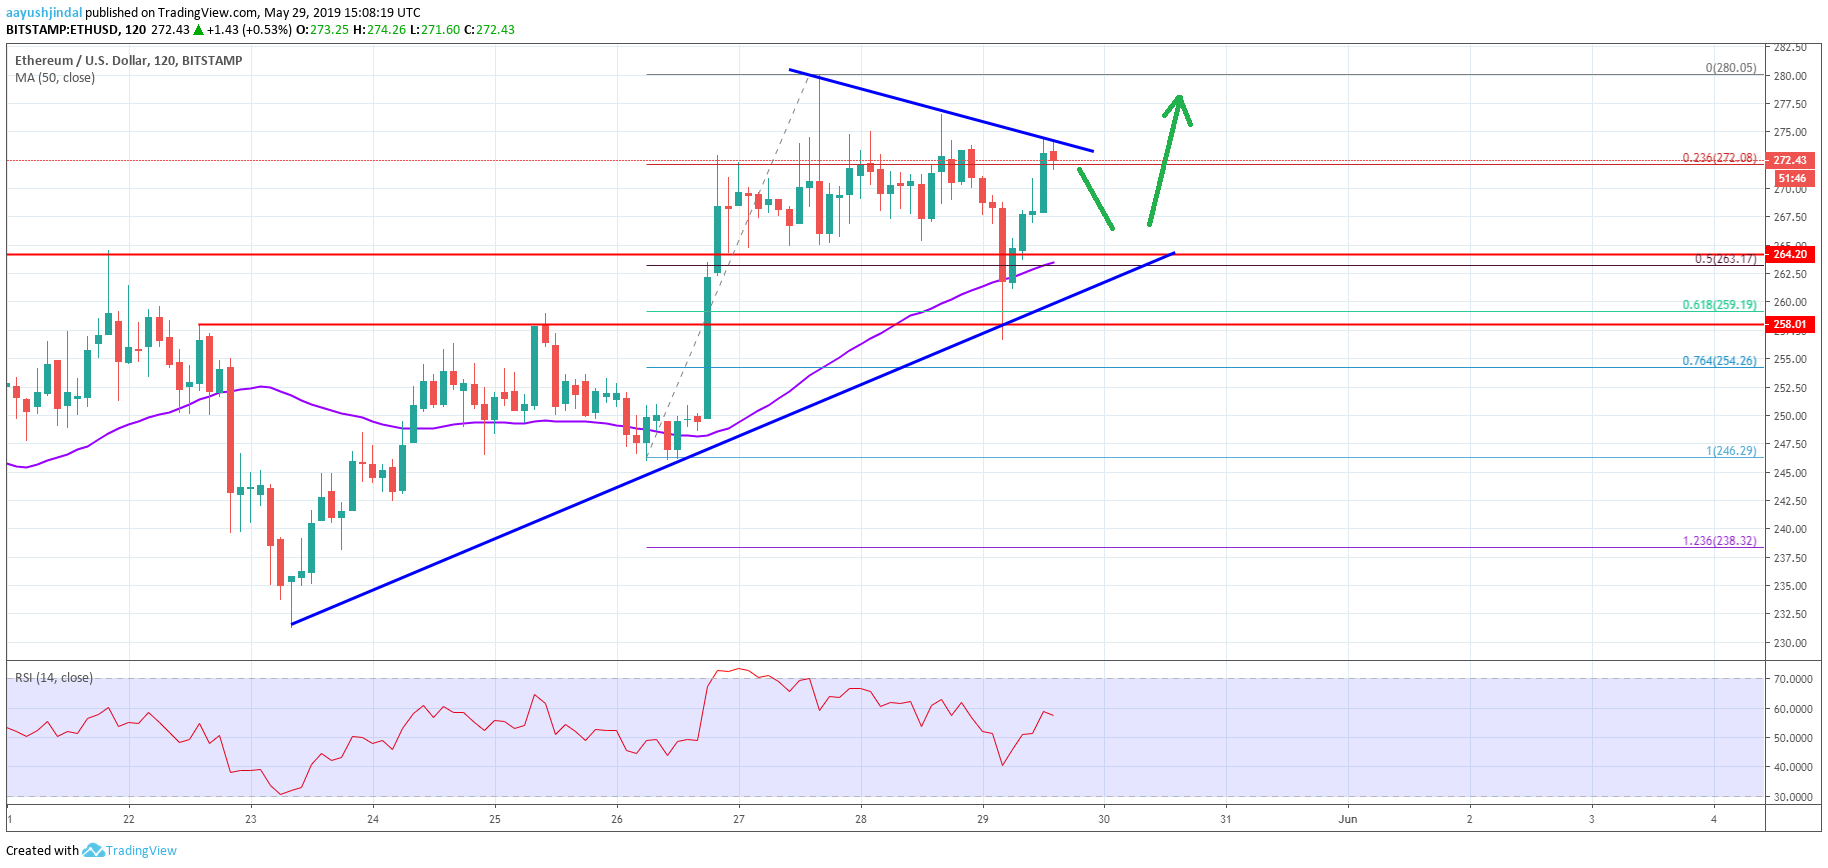
Looking at the 2-hours chart, Ethereum price failed on multiple occasions near $277.00 and $280.00. As a result, there was a sharp downside correction below the $270.00 and $265.00 support levels.
The price even broke the 50% Fib retracement level of the last rally from the $246.29 to $280.05. There was a spike below the $260.00 support, but the $258.00 level acted as a strong support and prevented further losses.
More importantly, the price bounced back after testing the $258.00 support and the 50 simple moving average (2-hours, purple). The 61.8% Fib retracement level of the last rally from the $246.29 to $280.05 also acted as a decent support.
The price is now trading above the $265.00 and $270.00 level. However, the bulls are struggling near the $272.00 resistance and below a major bearish trend line on the same chart.
If there is a clear break above the trend line and $274.00, there are chances of a strong rally above the $280.00 and $282.00 resistance levels.
The next important resistances are near the $285.00 and $292.00 levels, above which Ethereum price is likely to test the $300.00 level. On the downside, there are many supports near the $268.00, $265.00 and $258.00 levels.
Overall, ETH price is trading with a positive bias and it is likely to break the $274.00 and $280.00 resistance levels in the coming sessions.
Recently, there was a sharp downside correction in bitcoin and Ethereum. ETH/USD declined below the $250.00 support level and it seems like the price could even test the $225.00 support area.
Key Takeaways: ETH/USD
- Ethereum price failed to surpass the $264.00 and $265.00 levels and declined recently against the US Dollar.
- ETH/USD traded below the key $250.00 support and a bullish trend line on the 2-hours chart (data feed from Bitstamp).
- Most altcoins like XRP, XLM, BCH and EOS are down today.
Ethereum Price Analysis
Today, there was a bearish reaction in bitcoin price below the $7,750 level, igniting downsides in bitcoin cash, ripple and Ethereum. ETH price failed on multiple occasions near the $264.00 and $265.00 levels, and recently started a sharp downside move.
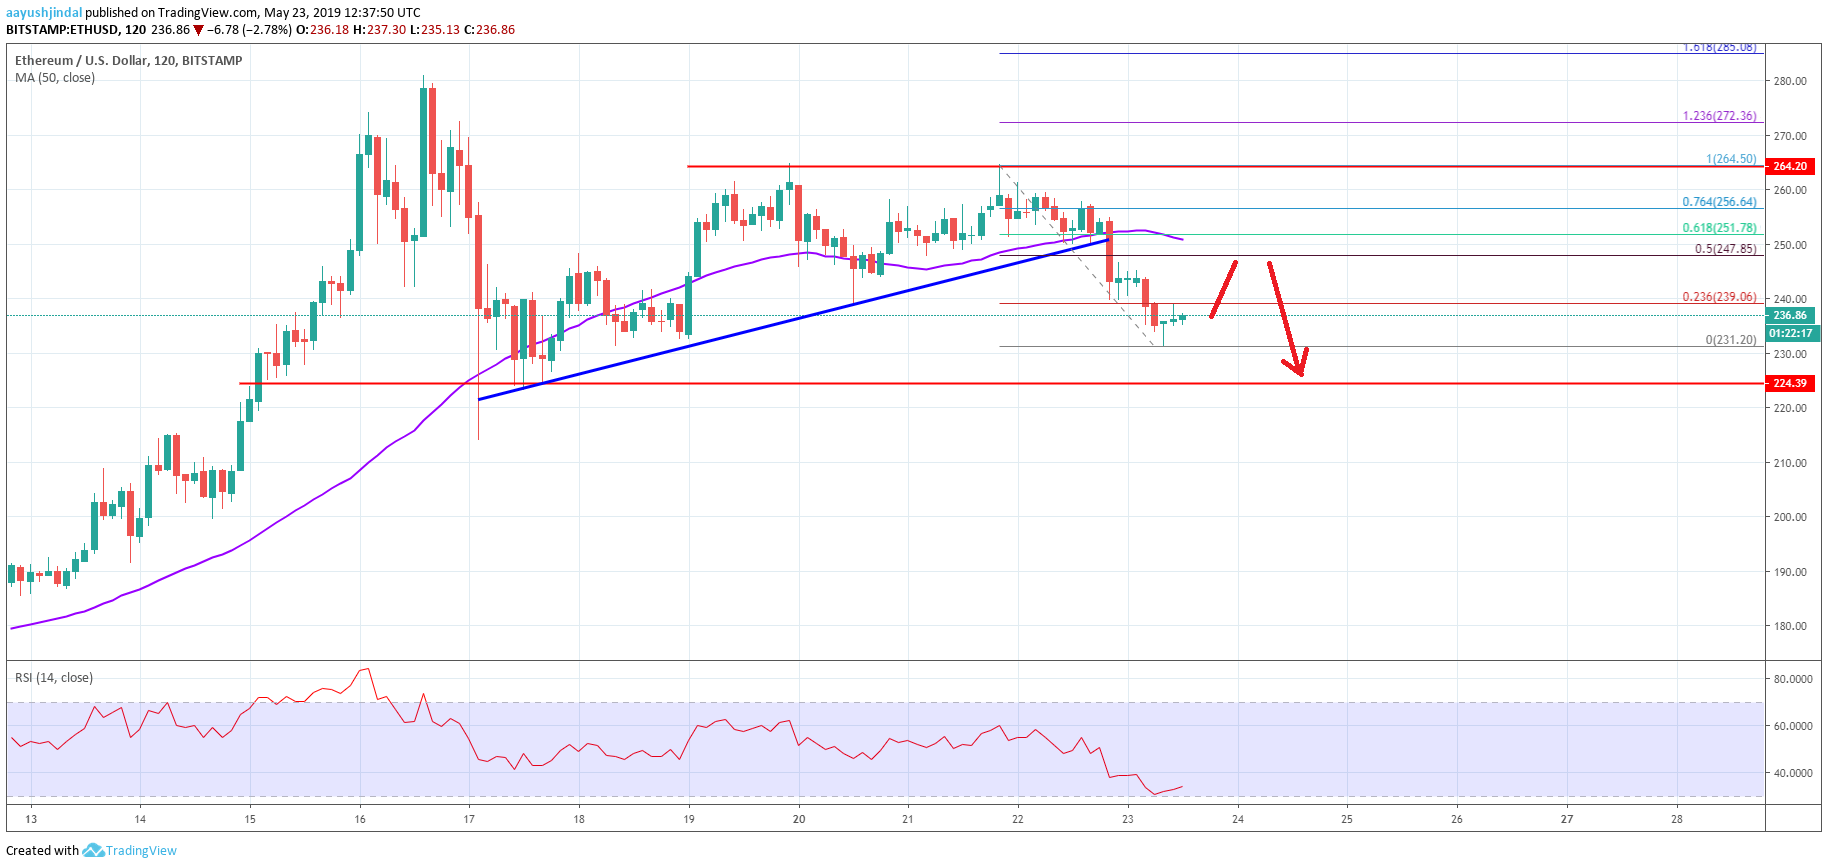
Looking at the 2-hours chart, Ethereum price broke the key $260.00 and $250.00 support levels to enter a bearish zone. The price even settled below the $250.00 level and the 50 simple moving average (2-hours, purple).
Moreover, the price traded below $248.00 and a bullish trend line on the same chart. The decline was such that the price even traded below the $240.00 level and formed a new intraday low near the $231.20 level.
The price is currently consolidating and is testing the 23.6% Fib retracement level of the drop from $264.50 to $231.20. On the upside, there are many hurdles near the $247.50 and $248.00 levels.
Besides, the 50 simple moving average (2-hours, purple) is near $248.00 along with the 50% Fib retracement level of the drop from $264.50 to $231.20. A successful break above the $248.00 and $250.00 resistance levels could only start a decent upward move.
On the downside, an initial support is near the $231.00 and $230.00 levels. If Ethereum price trades below the $230.00 support, the next major support for the bulls near the $225.00 level.
Overall, ETH/USD is currently under pressure below $248.00 and $250.00. Therefore, there are chances of more losses towards the $225.00 support area before the bulls come back into action. Below $225.00, the next crucial supports are near the $221.00 and $215.00 levels.

Bitcoin Price Starting to Recover After Sharp Drop; Top Alts Ethereum and Litecoin Are Struggling

Bitcoin (BTC), Ethereum (ETH), and Litecoin (LTC) Price Prediction for Today’s Top Cryptocurrencies

Ripple Price Analysis: XRP/USD Primed For Further Gains

Bitcoin Price Analysis: BTC Surging, Next Stop Could Be $9,750

Ethereum Price Analysis: ETH Approaching Significant Support Area

Bitcoin Price Analysis: BTC Setting Up For Another Bull Run

Crypto Media Site CCN Announces It’s Shutting Down After Latest Google Update

Bitcoin (BTC), Ethereum (ETH), Litecoin (LTC) and Bitcoin Cash (BCH) Price Analysis June 10th

Facebook and the CFTC Discuss The Future of the GlobalCoin
