Price Analysis
Bitcoin (BTC), Ethereum (ETH), Litecoin (LTC) and Bitcoin Cash (BCH) Price Analysis June 10th

BItcoin BTC/USD Forecast
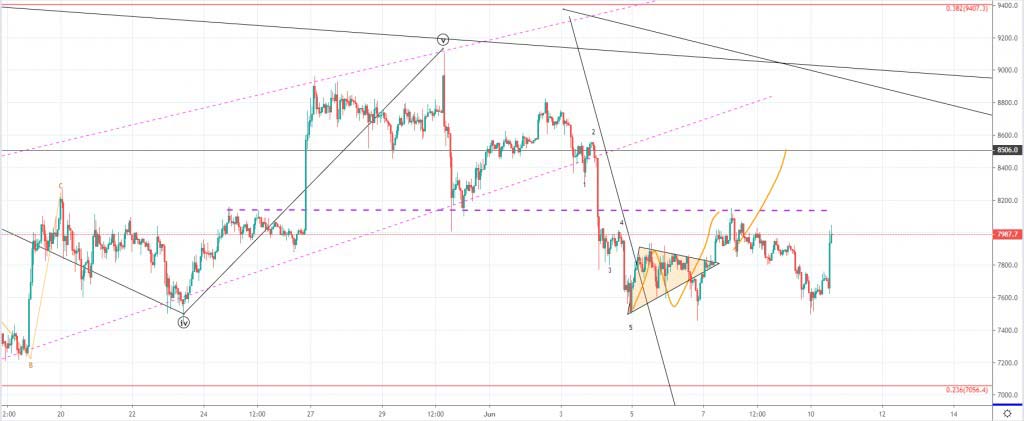
Last Friday the price of Bitcoin came up for interaction with the first significant horizontal resistance at $8140. As the interaction ended as a rejection the price was propelled in a downward trajectory and came down to the levels of the prior low at $7576 which was a decrease of around 6.7%. From today's open which was around the mentioned prior low level, the price has increased by 5.43% with strong bullish momentum as the majority of the increase occurred in only one hour but we are now seeing the price struggling to keep up the upward movement slightly lower then on the prior high.
Click to see a full size chart
On the hourly chart, you can see that the price encountered resistance, indicated by the wick from the upper side of the last hourly candle and is now likely to keep interacting with the current level as it's retesting it for resistance further. If the price manages to keep up the upward movement we could see a breakout to the upside from the first significant resistance point and to the next on at around $8500.
This would be unlikely if the found resistance proves to be stronger then the currently seen bullish momentum as a rejection at the current levels would likely lead to a lower low below the one made on 5th at $7506. The price spiked to those levels on today's open but a proper interaction with a lower spike would likely occur if the increase was seen would be stopped out at the mentioned first significant resistance as it would mean that from last Thursday we have been seeing the development of the five-wave move to the downside out of the starting downtrend.
Litecoin LTC/USD Forecast
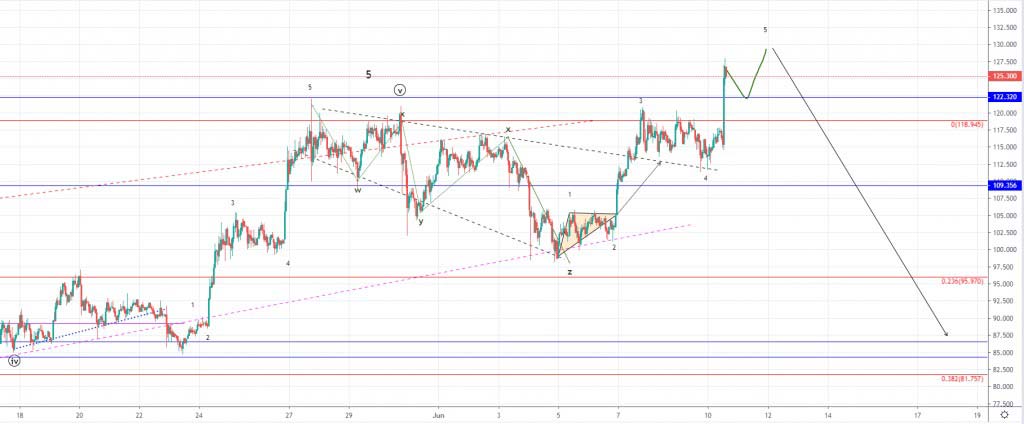
Last Friday the price of Litecoin increased by around 9.6% coming from $109.96 to $120.47 at its highest which has pushed the price above the first significant resistance level at the descending channels resistance. The price came down for a retest of support at the broken level over the weekend and as it found support it continued moving to the upside above the prior high level, coming to $126.8 at its highest point today.
Click to see a full size chart
The price came above the 0 Fibonacci level which was the ending point of the prior high and above the next highly significant horizontal level at $122.32 above which it is considered to be the sellers' territory. I was expecting the price to start moving to the downside after an interaction with the first significant resistance at the descending channels resistance but as the price continued increasing further past the other significant resistance point we have likely seen the development of another five-wave move to the upside. As the move looks finished or near completion and especially considering that the price has entered the seller's territory I will be shortly expecting the start of the impulsive move to the downside.
Even though we have seen a five-wave increase I don't believe that its the starting upside wave, but is more likely the second correctional structure after the first one currently labeled as a WXYXZ correction ended. The price did make a higher high but this can also be seen on a corrective move usually ending as a running flat. If we are soon the see the start of an impulsive move to the downside the first significant support zone for the price of Litecoin would be at around $83 area.
Ethereum ETH/USD Forecast
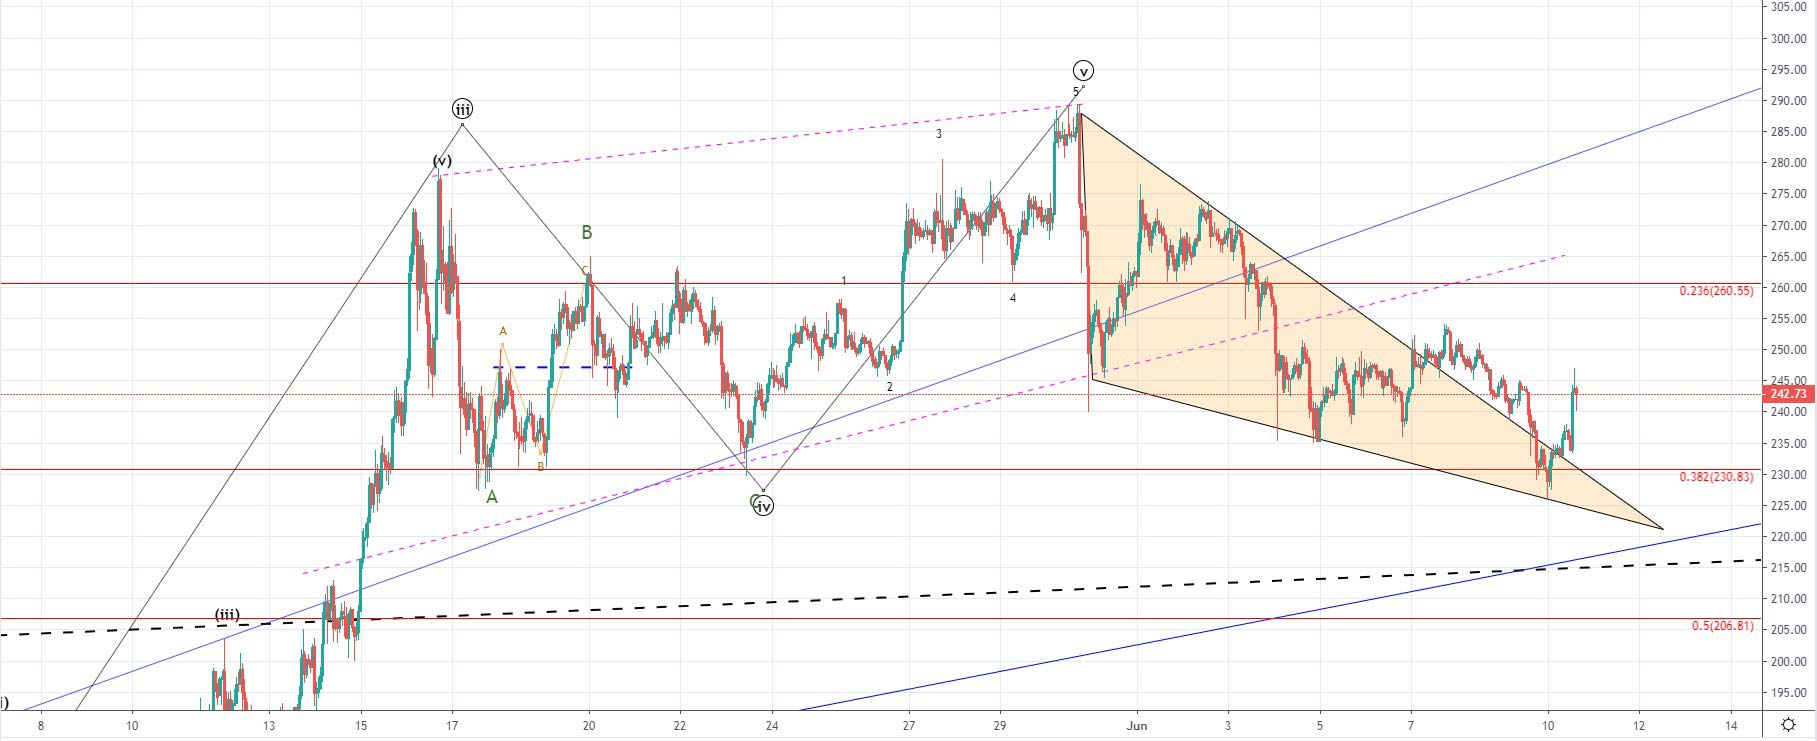
The price of Ethereum has increased from today’s open at $228.8 by 6.59%, coming to $243.4 at its highest point today but has encounterd strong resistance there and is currently being traded slightly below those levels.
Click to see a full size chart
On the hourly chart, you can see that the price came down over the weekend below the prior low at around the vicinitly of the 4th wave’s ending point from the previous upside move where it found support as the price immediately started moving impulsively to the upside again.
The rise has been stopped out at the previous horizontal support which now serves as resistance but since a breakout occurred to form the descending triangle which was formed from 30th of May we are likely to see the increase continue for a bit longer before the price continues moving to the downside again.
If the descending triangle was the first structure out of the starting downward move, the increase seen from today could be viewed as a correctional upside move in which case it cannot exceed the 258 level which is around half range between the last Thursdays high and today’s open.
Bitcoin Cash BCH/USD Forecast
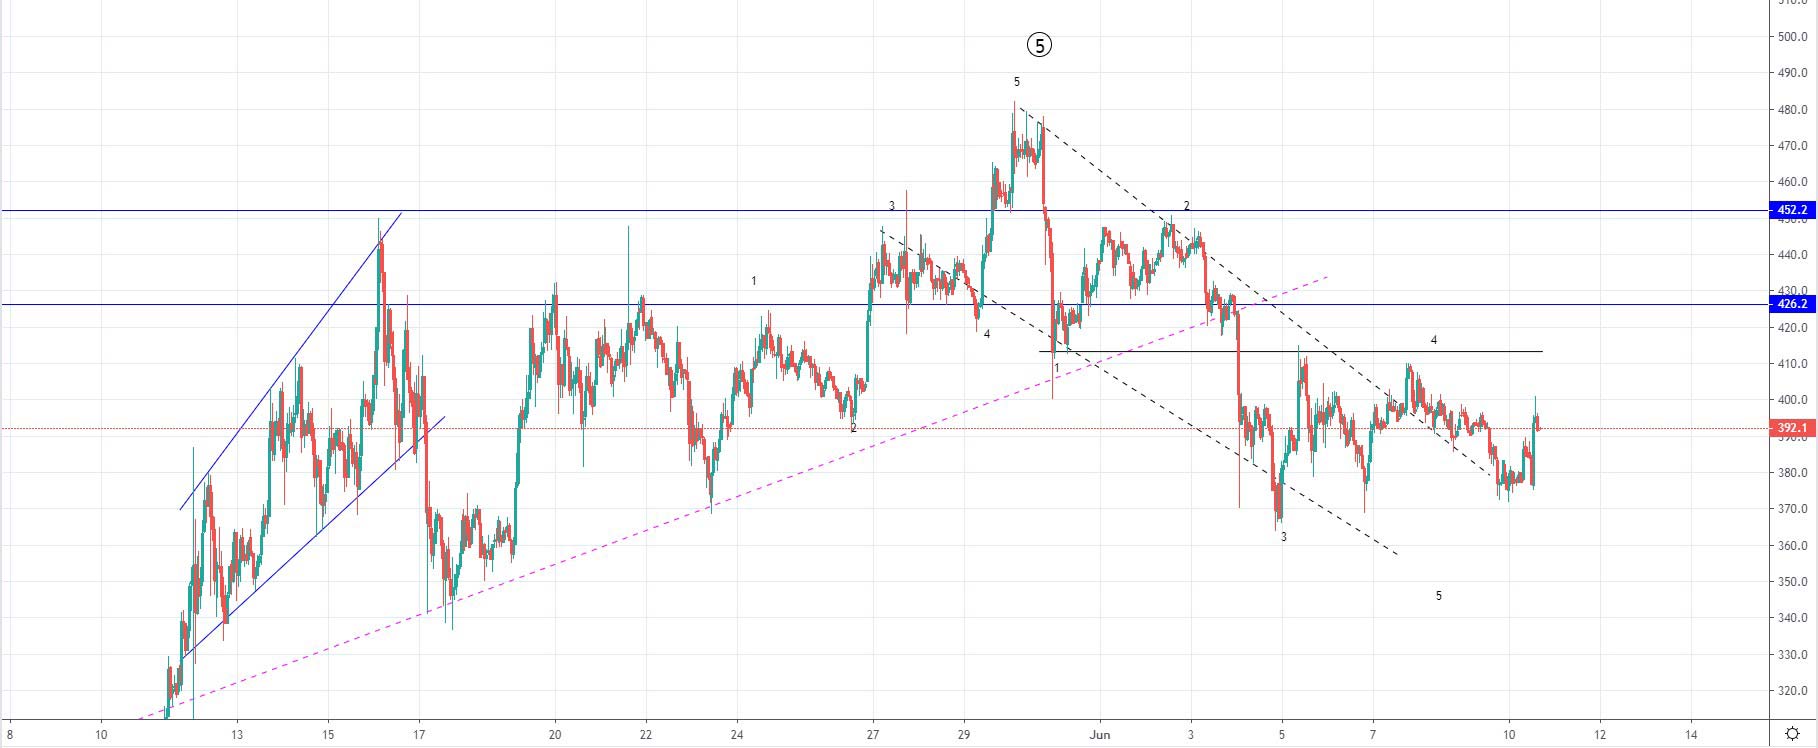
Over the weekend the price of Bitcoin Cash has decreased by 8.2% as it came down from $409.2 to $375.6 at its lowest point. From today’s open around the mentioned low level we have seen an increase of 5.36% to $395.7 but the price has encountered resistance as the rise has been stopped out.
Click to see a full size chart
On the hourly chart, you can see that the price decreased slightly above the last week’s low at $366.5 made on Wednesday which is why a lower low before the completion of the downward move would be expected if we are seeing the development of the five-wave move to the downside out of the starting downtrend.
If we are seeing the development of the 4th wave it cannot go above the $413 which the price interacted with over the weekend and found resistance there which makes this possibility higher. As the 4th wave is corrective in nature it could mean that today’s increase is still its development which we are to see from the currently encountered resistance interaction.
Conclusion
Over the weekend the prices have continued increasing to their first significant resistance point and have gotten rejected with the price going to the levels from which the increase was made. This movement could have been the end of the first wave from the starting downtrend but a more likely outcome would be that another lower low is coming before we see some major upside correctional movements.