Price Analysis
Bitcoin (BTC), Ethereum (ETH), and Litecoin (LTC) Price Prediction for Today’s Top Cryptocurrencies

BTC/USD
From yesterday's high at $13212 the price of Bitcoin decreased by 21.23% as it came down to $10407 at its lowest point today. Yesterday's high was an interaction with the significant 0.618 Fibonacci level which ended as a rejection and caused the price to start moving to the downside in an impulsive manner.
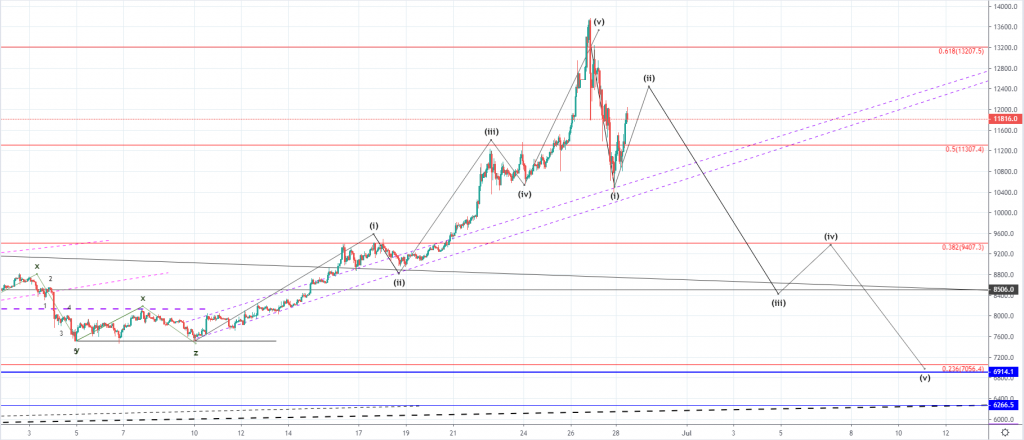

The price recovered by over 14% today measured to the lowest spike to the highest point today but it appears that strong resistance has been encountered as indicated by the last hourly candle. This recovery appears to be correctional and is most likely the 2nd wave out of the starting downtrend. I wouldn't expect it to go above $12451 which would be a 0.618 Fib from the impulsive decrease if the corrective movement is in play.
We've seen the completion of the five-wave impulse from 10th of June which could have been the 5th wave from the higher degree count which I believe that it was. If this is true, then we are going to see further downside for the price of Bitcoin in the upcoming period as a correction of the same degree should develop.
On the hourly chart, you can see that I've projected a target to around $6914 but the price of Bitcoin could go significantly lower as it would be only the first wave to the downside. The five-wave move might not develop and we could instead see a three-wave correction to $8500 before further upside continuation but considering the seller's momentum seen from yesterday, I don't believe that Bitcoin's price is going to continue increasing further.
ETH/USD
From yesterday’s high at $336.1 the price of Ethereum has decreased by over 18% measured to the lowest spike the price has been which is at $275.45, but the hourly candle closed above $290.7.
The price is currently being traded at around $304 and was in an upward trajectory until it reached the significant Fibonacci level at $308.59 where it found resistance on the interaction.
As a rejection occurred the price has started moving to the downside again and looking at the hourly chart you can see that its minor uptrend line still hasn’t been broken.
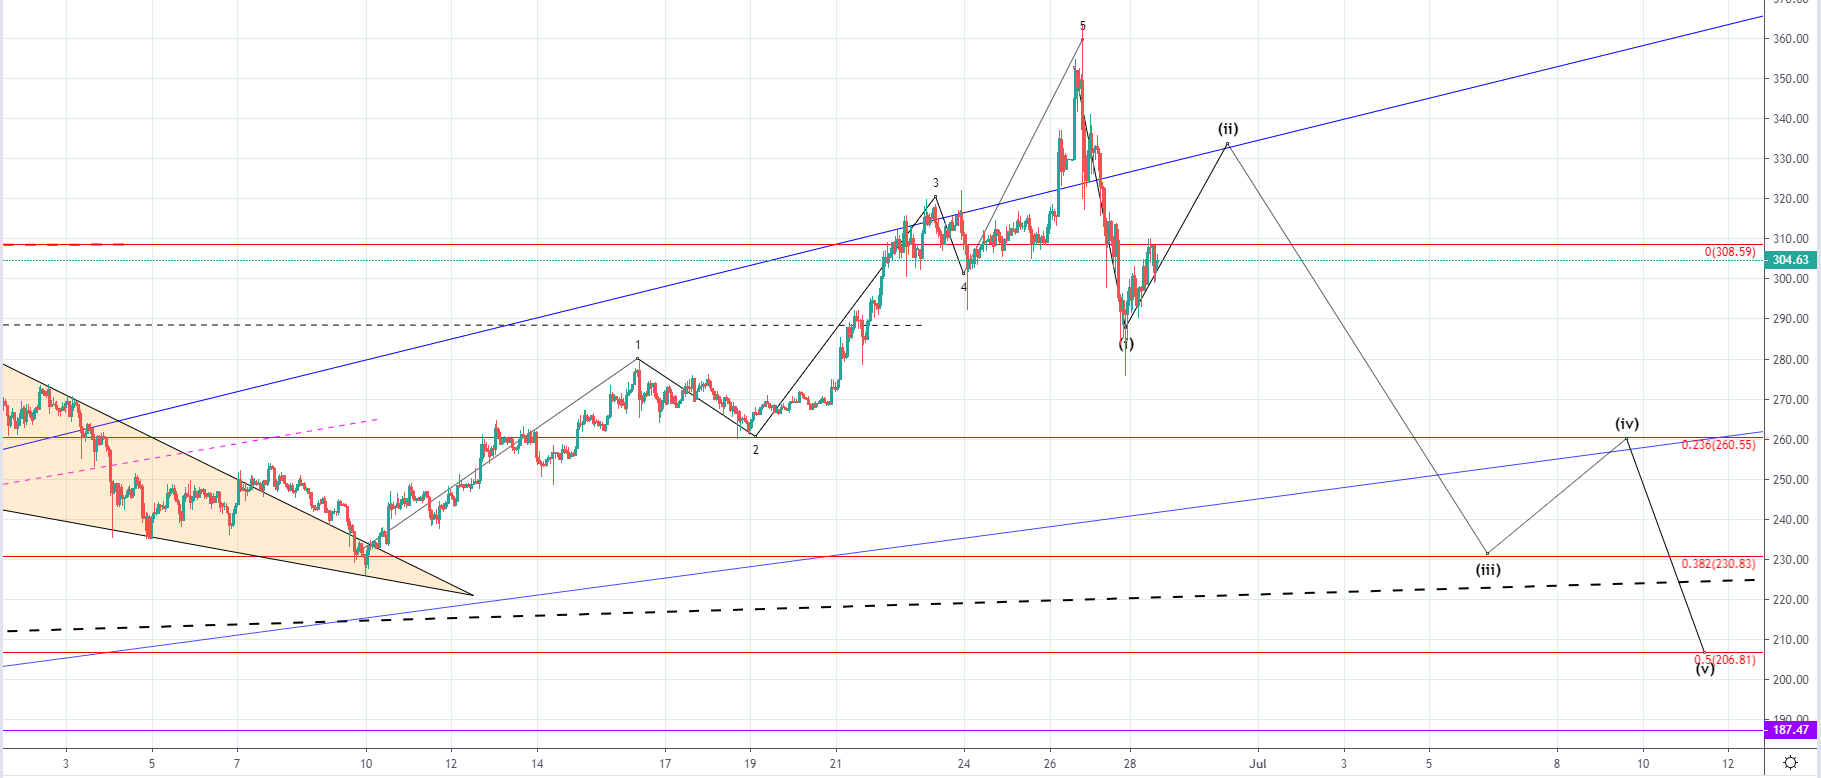

The increase still might continue to the significant ascending trendline which was broken but the price fell immediately inside the territory of the ascending channel, ending as a fakeout. This is why the level might get retested again on the current recovery but we are yet to see how strong is the momentum behind today’s increase.
For now, it looks weak as the Fibonacci level was able to stop it out, so now that the price started moving to the downside we could see the price starting to move below the minor ascending trendline from today’s low.
Prior to the impulsive decrease, we have seen the completion of the five-wave impulse to the upside which could have been the ending wave of the higher degree with now a downturn starting to develop as the bullish period ended.
If we are seeing the development of the higher degree correction we are likely to see a five-wave move to the downside in an impulsive manner which would only be the first wave out of the potential three-wave move of the higher degree.
In that case, the price of Ethereum would be expected to go for a retest of some major resistance point, broken on the way up, out of which the first significant one would be between $187 and $174.
LTC/USD
From yesterday's high at $130.322 the price of Litecoin has decreased by 13% coming to $113.36 at its lowest point and even spiked further to the downside coming to $110.69 but the hourly candle closed above $133 leaving a wick on the hourly chart. The price is currently being traded at $117.69 slightly below today's high at $119.7 as a minor recovery has been made. 
From 5th till 12th of June we have seen the development of the five-wave move to the upside which was most likely the ending wave of the higher degree as immediately after its completion we've seen a sideways range forming before a straight downfall. This impulsiveness to the downside indicates that the sellers are taking control. If we are seeing the development of the downtrend and from 26th its first wave in a five-wave manner the price is set to go below the last horizontal support level at $109 and would enter the lower range below the support zone.
If this occurs we could view it as a confirmation of the starting downtrend as the price of Litecoin was continuously increasing from 29th of April and made an increase of 112% without a major correctional movement. That this might not be a correction and instead of a starting downtrend we are yet to see from the development of the last move to the downside, but if it were to develop in a five-wave manner with the price going below the last horizontal level the possibility of the starting downtrend would increase significantly.
Conclusion
The cryptocurrency market has experienced a recovery today but the prices of the major cryptos have shown early signs of weakness around their first minor resistance points. We are yet to see if the recovery continues but as the impulsiveness was exhibited by the sellers in the last 24 hours I believe that the prices aren’t headed further up and that we are seeing the start of the downtrend.